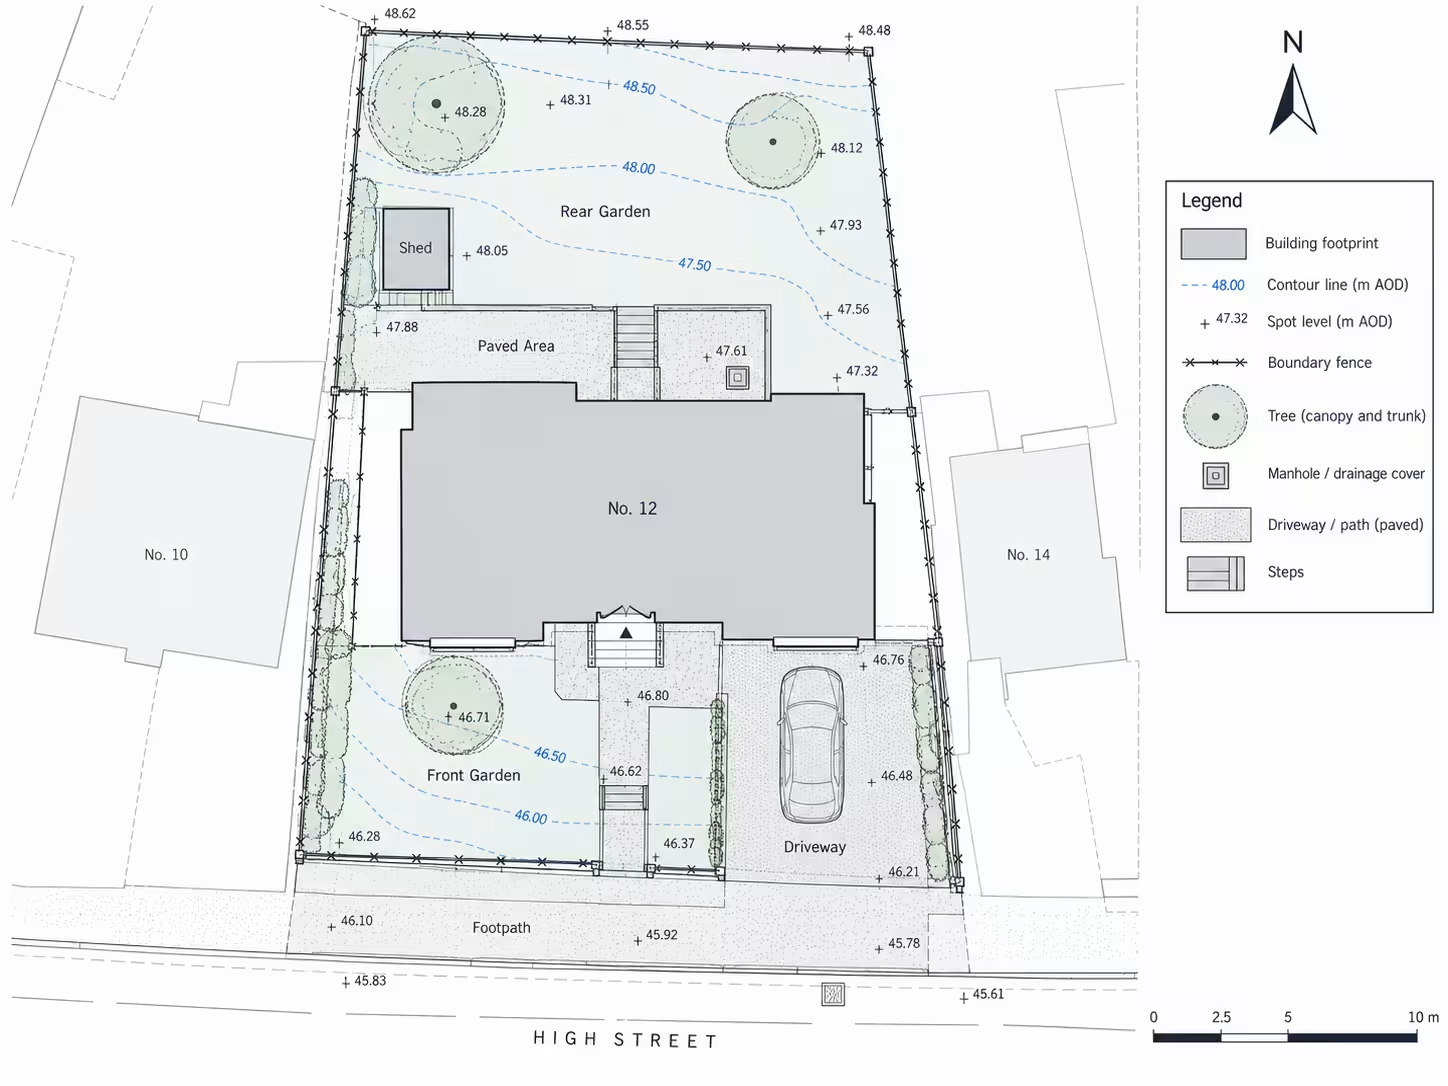
What does a topographical survey drawing show?
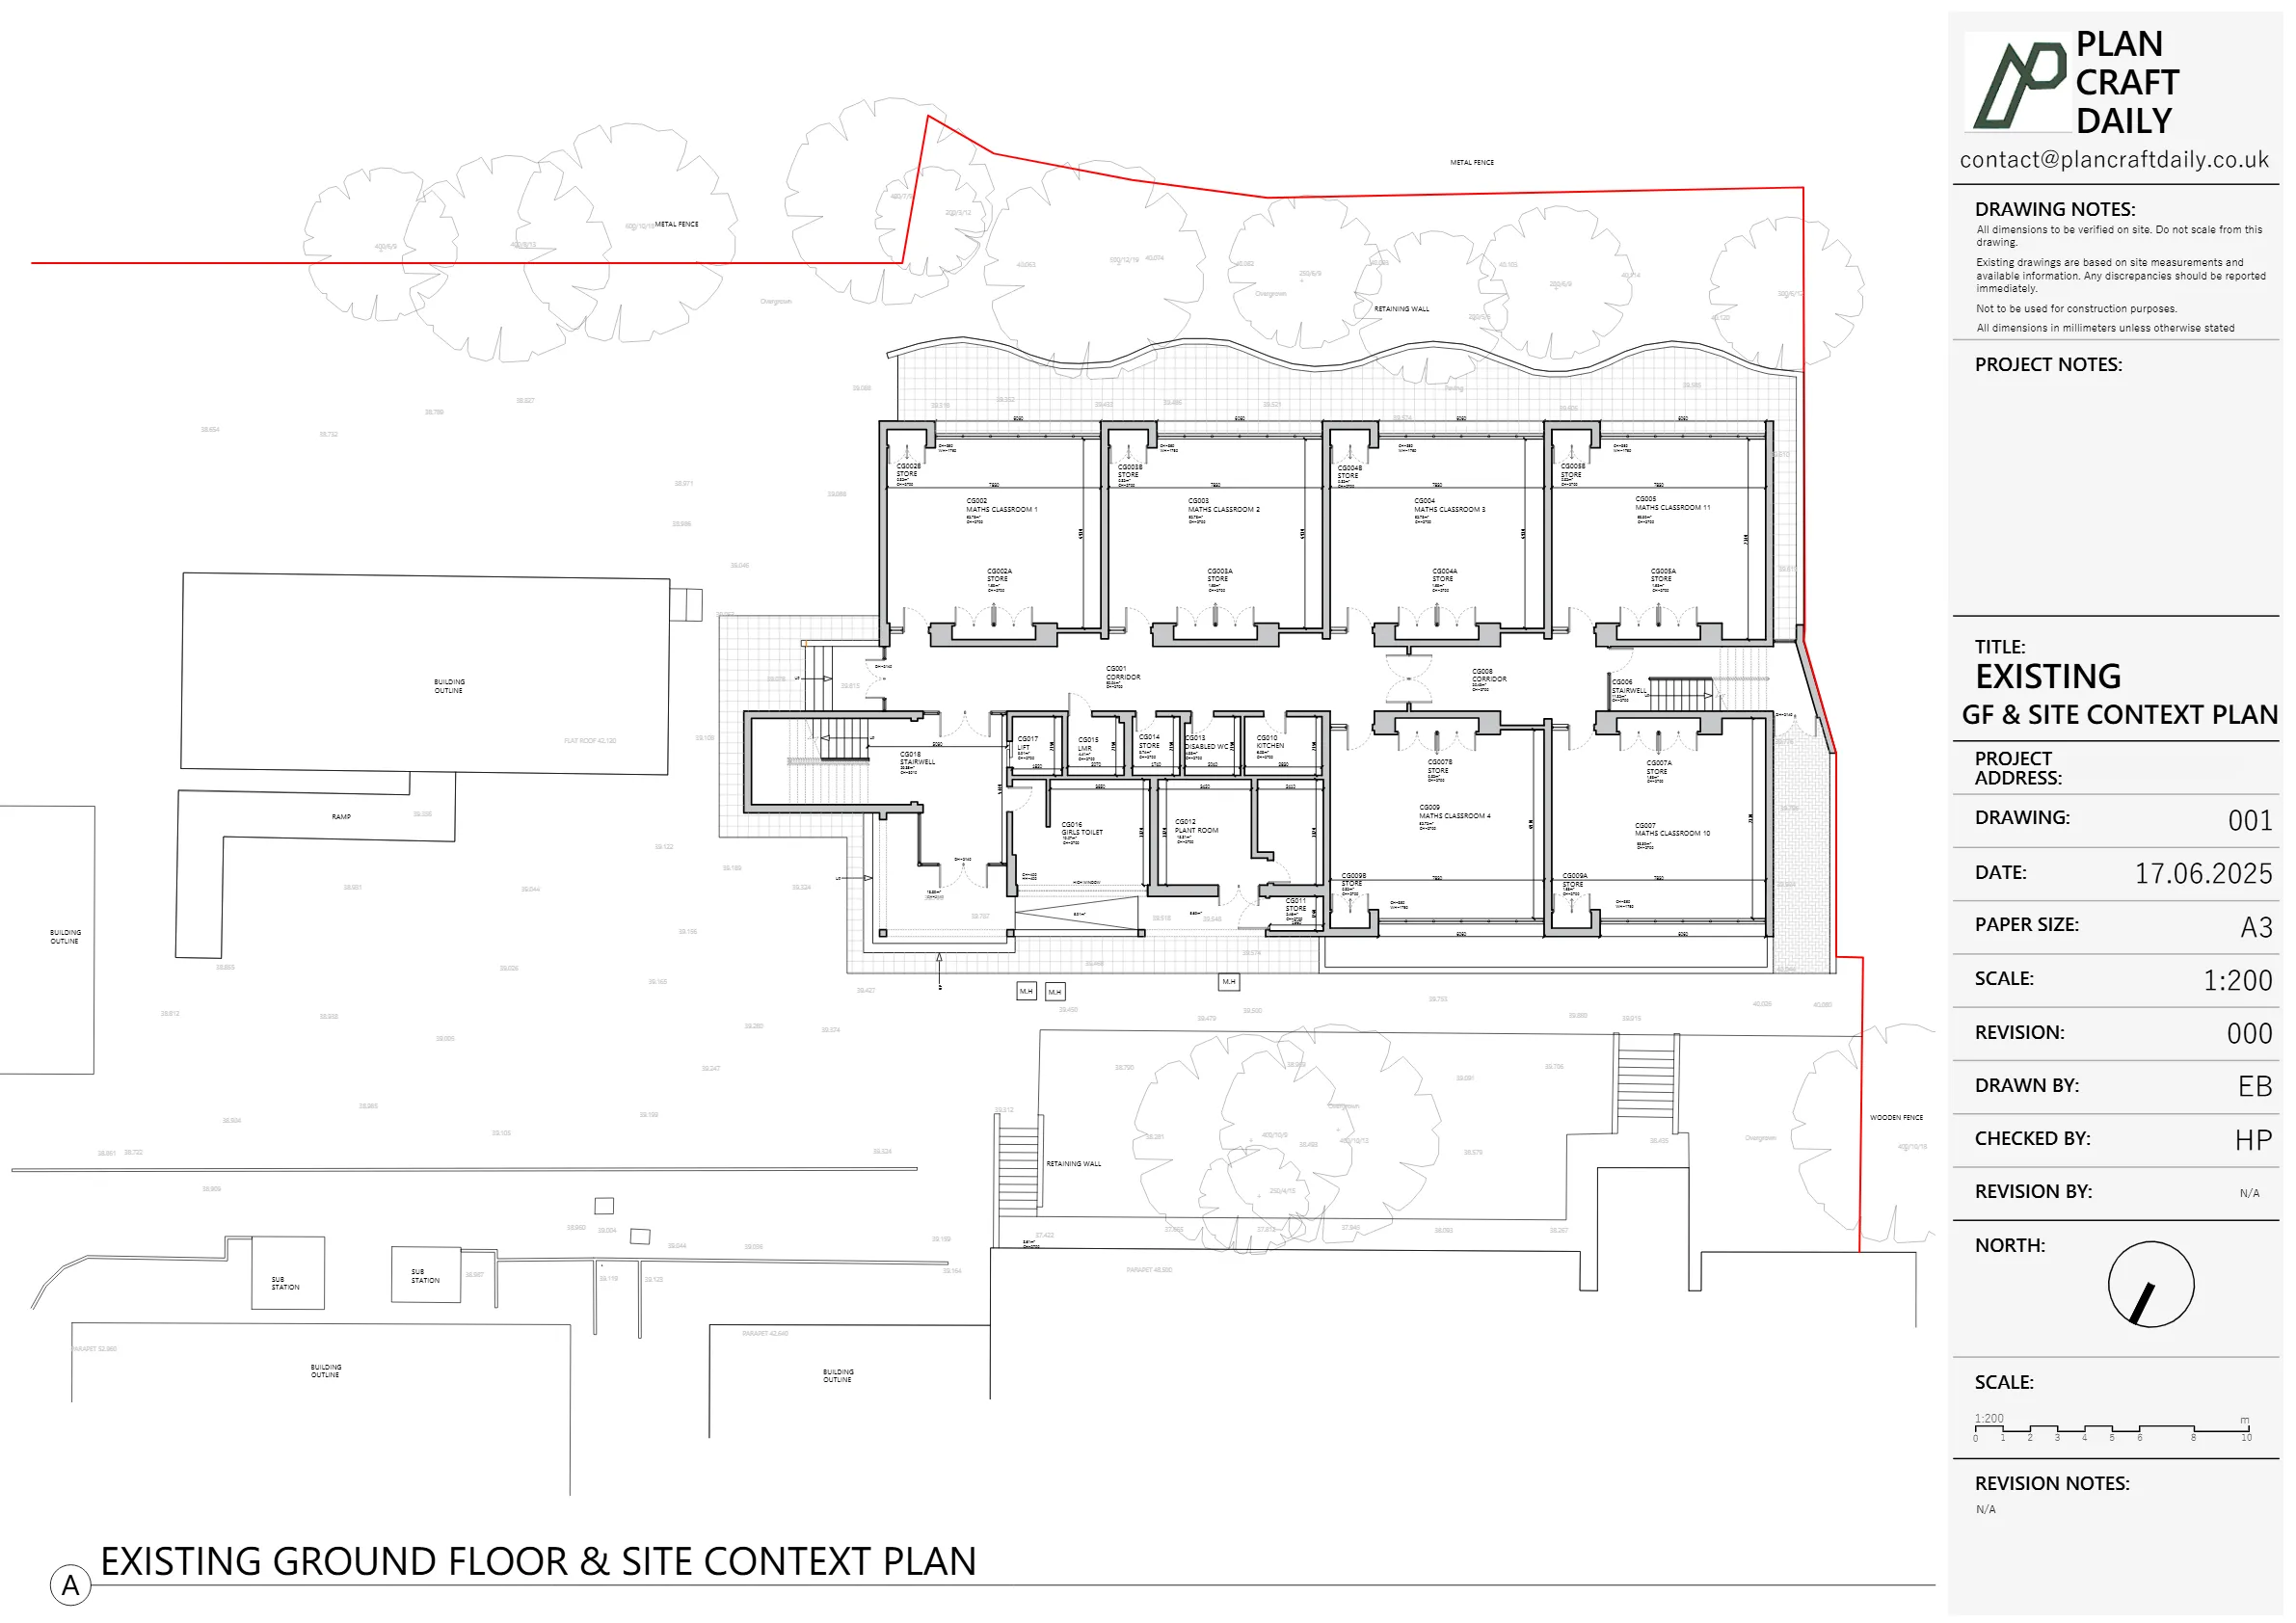
A topographical survey drawing shows the measured position of physical site features and changes in ground level. The exact content depends on the project brief and the information requested before the survey.
The drawing can include:
- Spot levels
- Contour lines
- Building footprints
- Finished floor levels
- Walls and fences
- Hedges and trees
- Roads and kerbs
- Paths and driveways
- Steps and retaining walls
- Manholes and gullies
- Visible utility covers
- Surface changes
- Street furniture
- Coordinate grid lines
- Survey control points
A topographical drawing does not automatically show every feature on the property. The surveyor records the items included in the agreed scope.
The guide to what is included in a topographical survey explains how the project brief controls the drawing content.
What should you check before reading a topographical survey drawing?
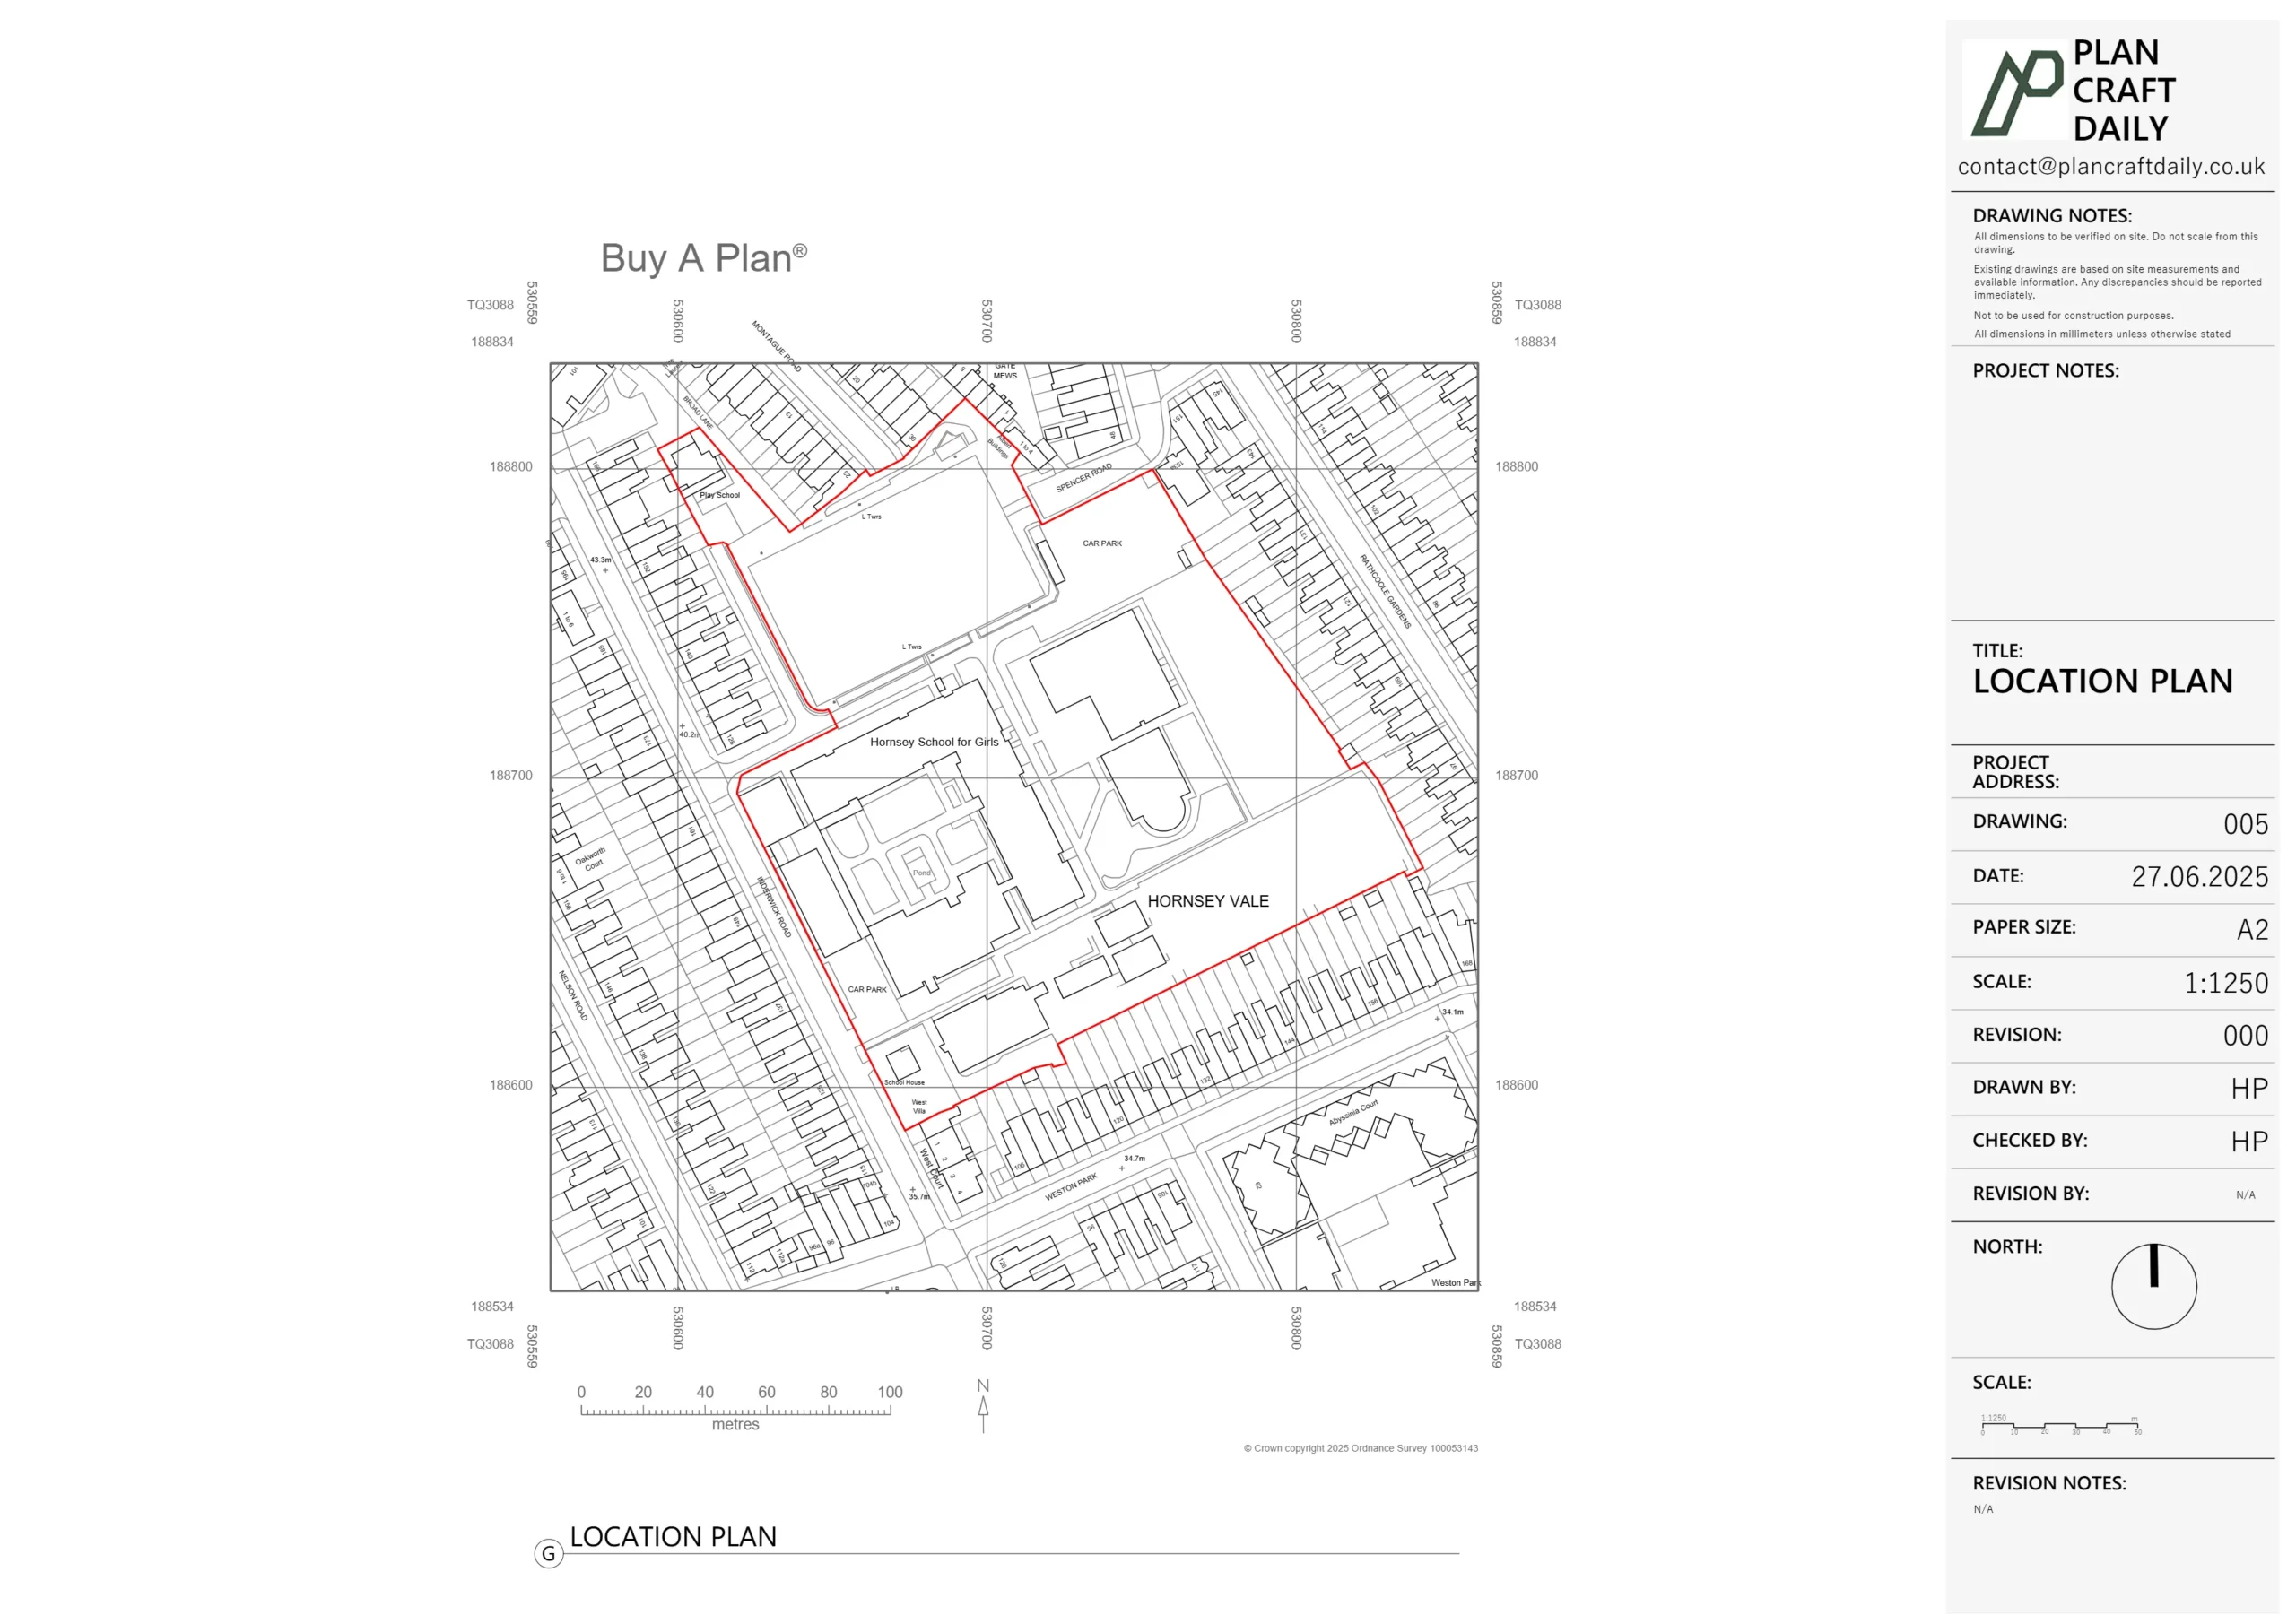
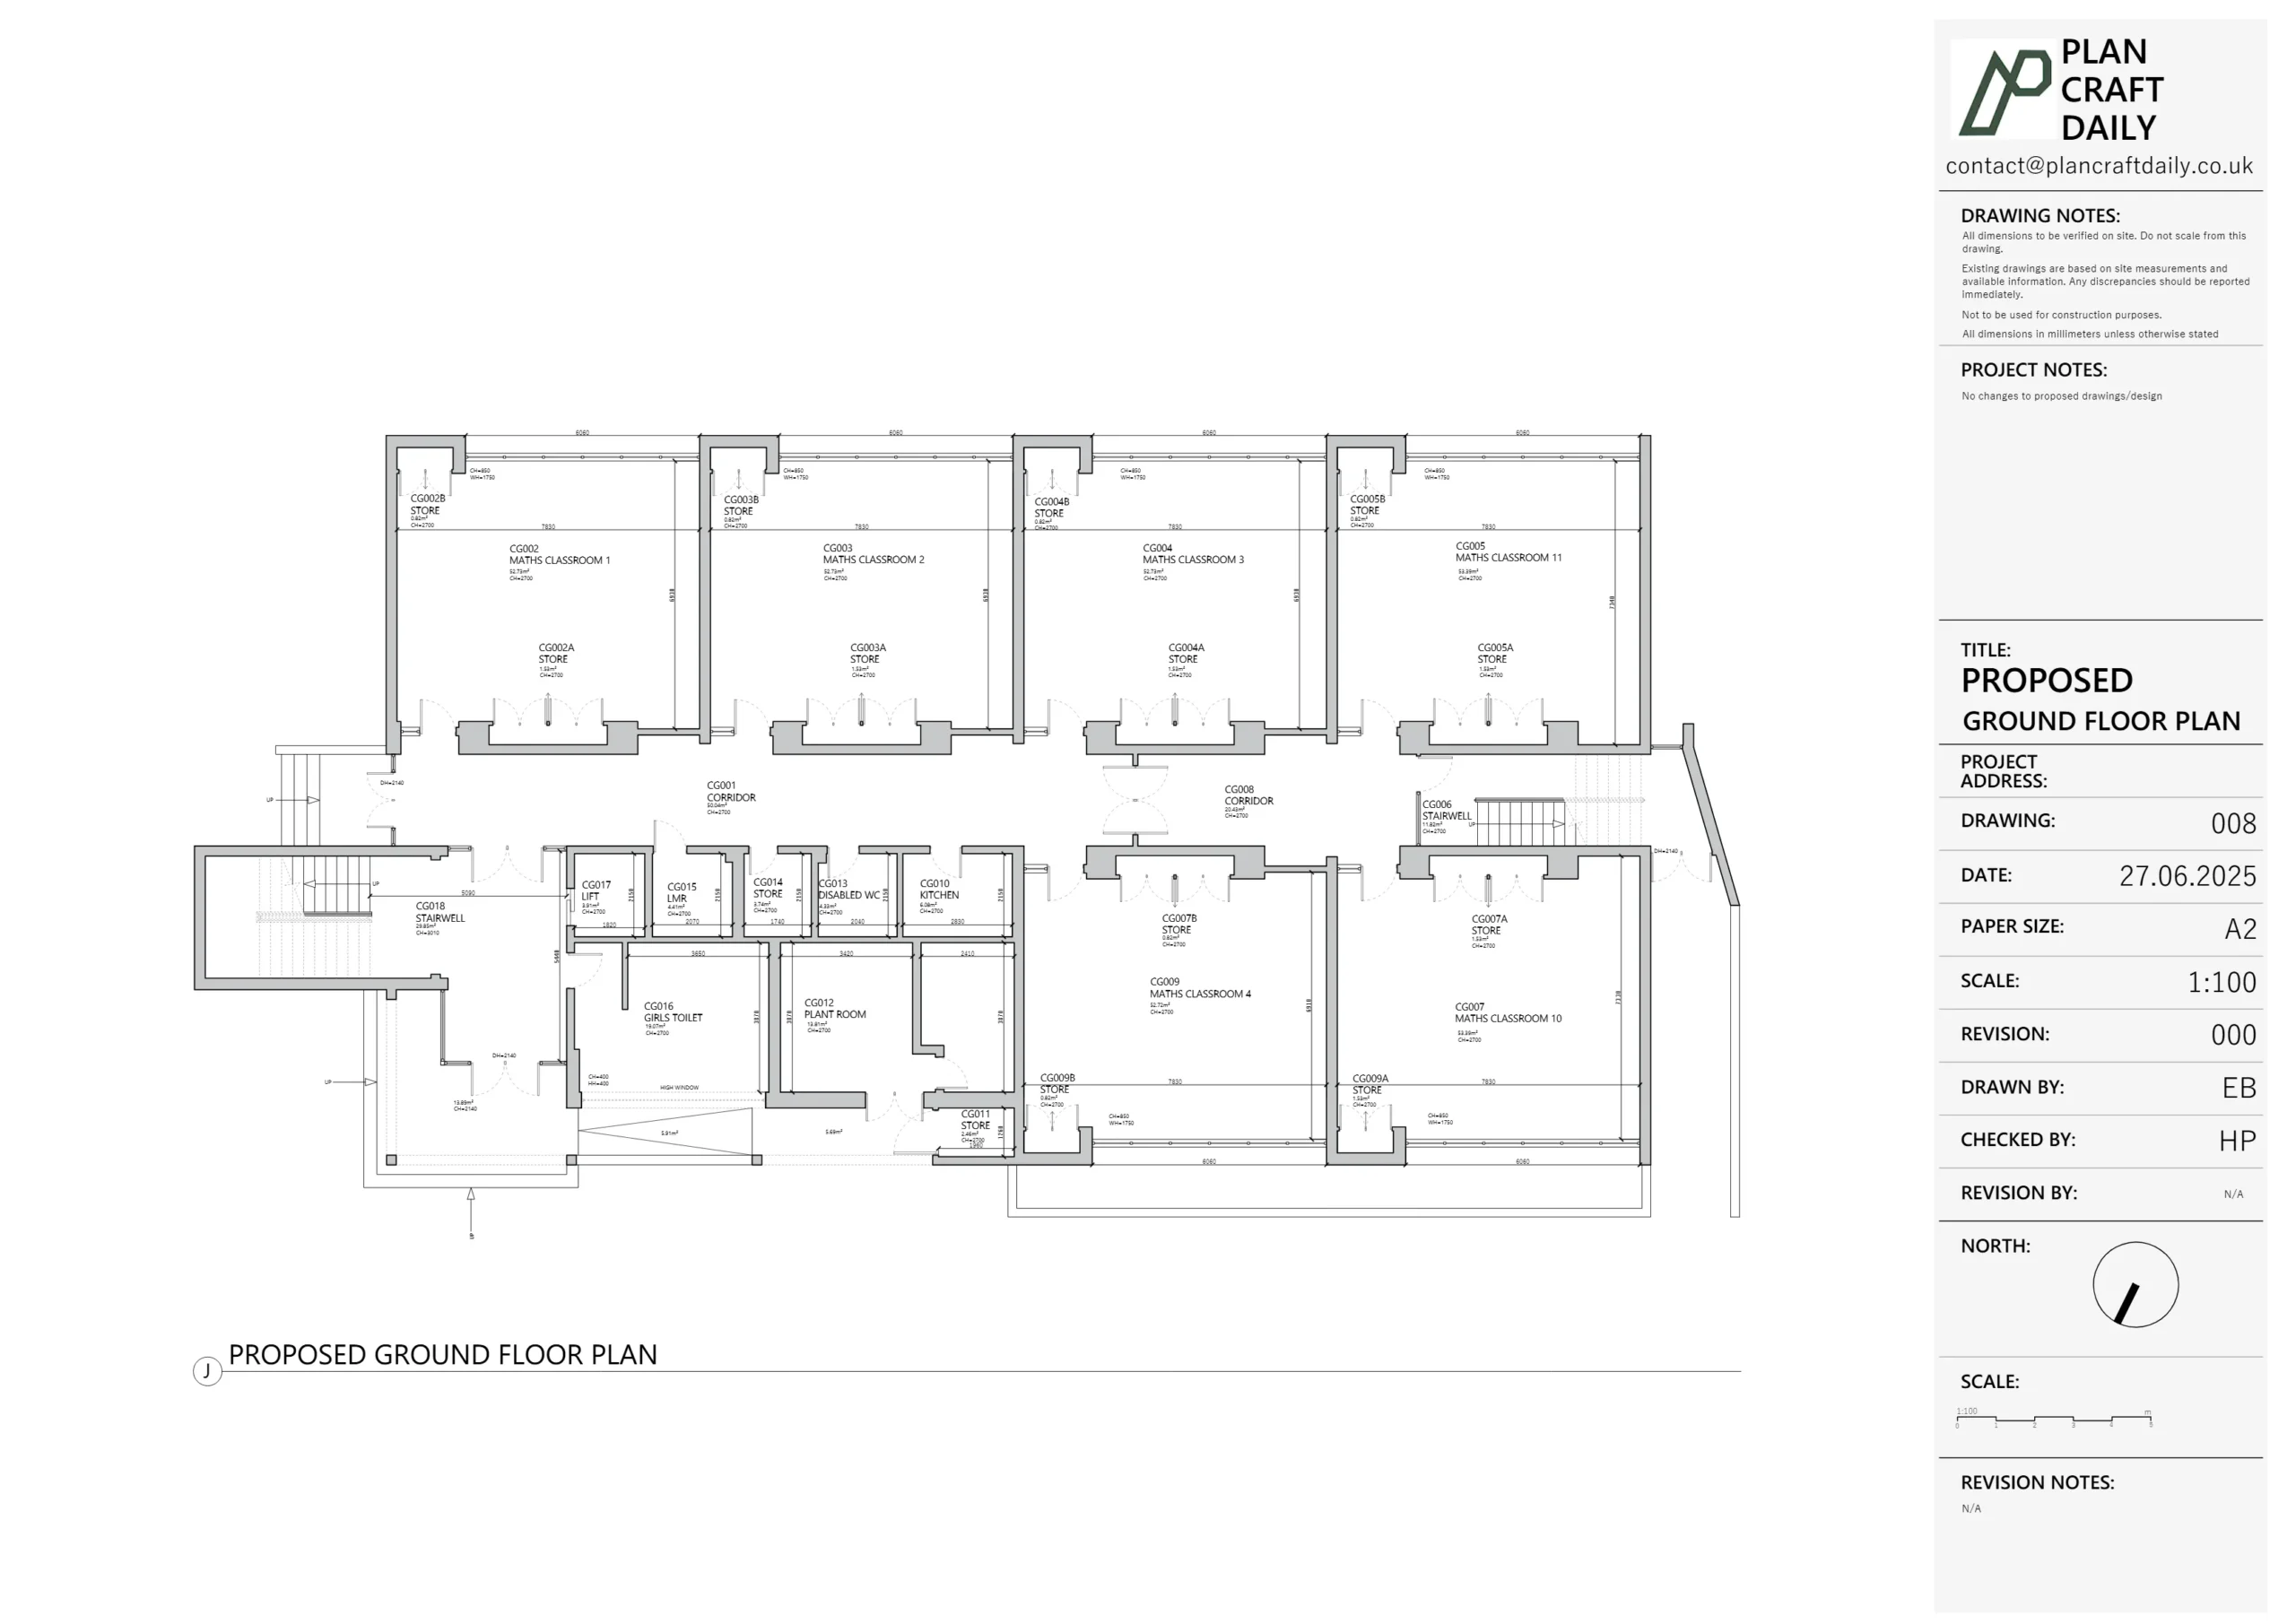
Check the drawing information before interpreting individual measurements. The title block and drawing notes identify the site, survey date, scale, units, datum, coordinate reference, revision and stated limitations.
Start with the following information:
| Drawing item | What it tells you |
|---|---|
| Project title | Identifies the property or development |
| Drawing title | Describes the survey content |
| Drawing number | Identifies the individual drawing |
| Revision | Shows which version you are viewing |
| Survey date | States when the site information was collected |
| Scale | Shows the relationship between the drawing and the site |
| Units | Confirms whether measurements use metres or millimetres |
| North point | Shows the drawing’s orientation |
| Level datum | Identifies the reference used for heights |
| Coordinate system | Identifies the reference used for positions |
| Legend | Explains lines, abbreviations and symbols |
| Survey notes | State qualifications, exclusions and limitations |
Do not begin measuring from a printed or on-screen drawing before checking its scale. Printing settings and screen zoom can change the displayed size.
Use the written dimensions or the original CAD data where accurate measurements are required.
How do you use the north point on a topographical survey?
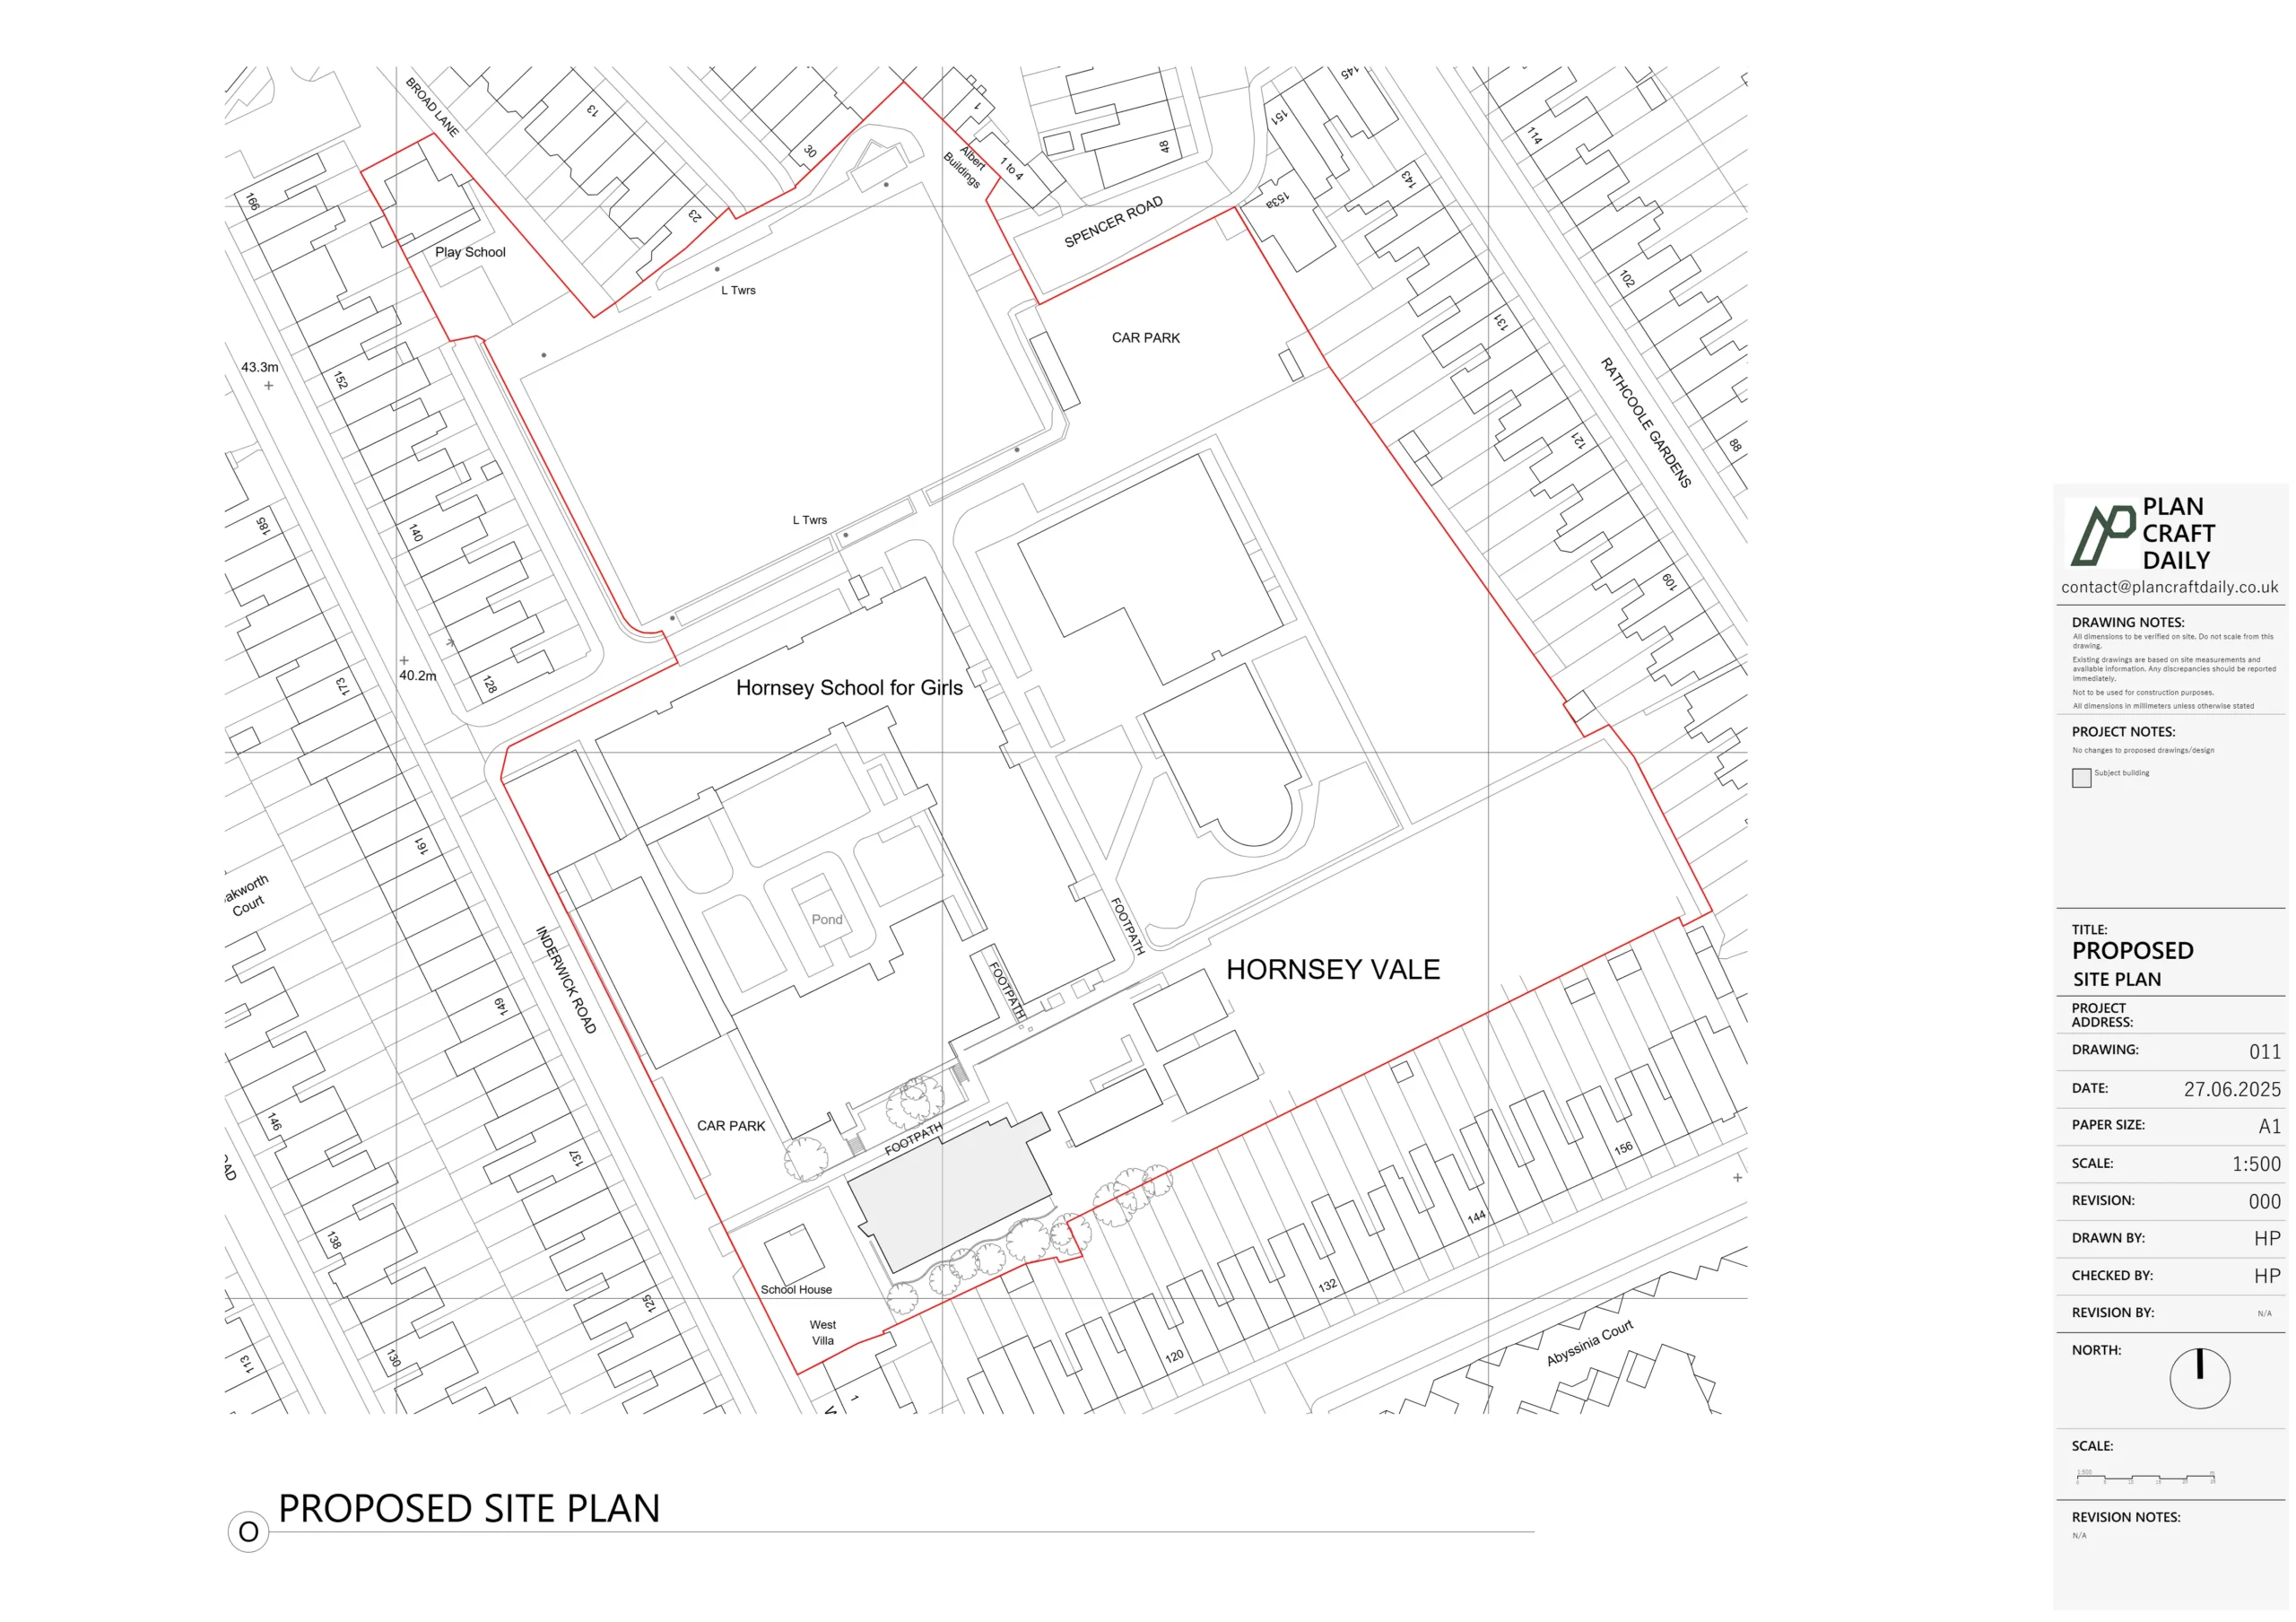
The north point establishes the drawing’s orientation and helps relate the survey to maps, planning drawings and the physical site. North is not always positioned at the top of the drawing sheet.
Locate the north arrow before describing features as front, rear, left or right. This check prevents confusion when different drawings use different orientations.
The north point can help the project team understand:
- The site’s relationship with adjoining roads
- The orientation of buildings
- The direction of neighbouring properties
- The position of gardens and access routes
- The relationship between survey and planning drawings
Do not use the north arrow to estimate dimensions or levels. It shows orientation only.
What does the scale mean on a topographical survey drawing?
The drawing scale shows how a measured distance on the drawing relates to the real distance on site. A scale of 1:200 means one unit on the drawing represents 200 of the same units on the site.
The drawing scale affects the amount of detail that can be displayed clearly.
A smaller survey area can be shown at a more detailed scale. A larger site normally needs a scale that fits the information onto a practical sheet size.
Always check:
- The stated drawing scale
- The intended paper size
- Whether the drawing was printed at full size
- Whether a PDF was reduced or enlarged
- Whether a scale bar is included
The scale shown in the title block normally applies only when the drawing is printed at the specified sheet size.
Use CAD information or stated dimensions for design work. Do not rely on measurements taken from a resized PDF.
What is a level datum on a topographical survey?
The level datum is the fixed reference from which every height on the survey is measured. The drawing must identify whether the levels use an established national reference or a local project datum.
A local datum is a project-specific reference value assigned to a stable point. It provides consistency within the survey but does not automatically relate to national height information.
An Ordnance Datum level relates heights to the national vertical reference used in Great Britain. The drawing notes should state the exact reference used.
Never compare levels from separate surveys until their datums have been checked. Two identical-looking level values can refer to different height systems.
The Ordnance Survey guide to coordinate systems in Great Britain explains the national systems used to position and reference survey information.
What are spot levels on a topographical survey?
A spot level is the measured height of one exact point on the site. Spot levels show the height of the ground, a surface or a specific feature relative to the survey datum.
A spot level normally appears as a numerical value beside a point marker or cross.
For example:
- A level beside a path records the height of that point on the path
- A level beside a building entrance can record the threshold height
- A level beside a manhole can record the cover level
- A level at the base of a wall records the ground height at that position
Compare nearby spot levels to understand the direction and amount of change across the site.
A larger level value represents a higher position when all values use the same datum. A smaller value represents a lower position.
Do not assume what surface a number refers to. Check its point marker, label and location.
What are contour lines on a topographical survey?
A contour line joins points that share the same height. Contours provide a visual picture of the ground’s shape, slope and changes in elevation.
Contour labels show the level represented by each line. The contour interval is the vertical difference between neighbouring contour lines.
The spacing between contours helps explain the ground:
- Closely spaced contours indicate a steeper slope
- Widely spaced contours indicate a gentler slope
- Evenly spaced contours indicate a consistent gradient
- Irregular contours indicate changing ground conditions
- Closed contours can indicate a raised or lowered area
Contour lines provide a model of the ground rather than a physical feature visible on the site.
Read contours together with spot levels. Spot levels provide exact measured values at selected positions, while contours show the broader shape between them.
How can you identify slopes and changes in level?
Compare the spot levels and contour values in the direction you want to examine. A sequence of decreasing values shows falling ground, while increasing values show rising ground.
The amount of level change is the difference between two values.
The horizontal distance between those points also matters. The same vertical change over a short distance creates a steeper slope than it does over a long distance.
Look for physical features that explain a sudden change, including:
- Steps
- Retaining walls
- Embankments
- Kerbs
- Ramps
- Raised patios
- Sunken areas
- Ditches
A break line can also show a clear change in the ground surface. The legend or drawing notes should explain the line style used.
An engineer or architect should calculate design gradients from the digital survey data. Visual inspection alone does not provide a complete design assessment.
How are buildings shown on a topographical survey?
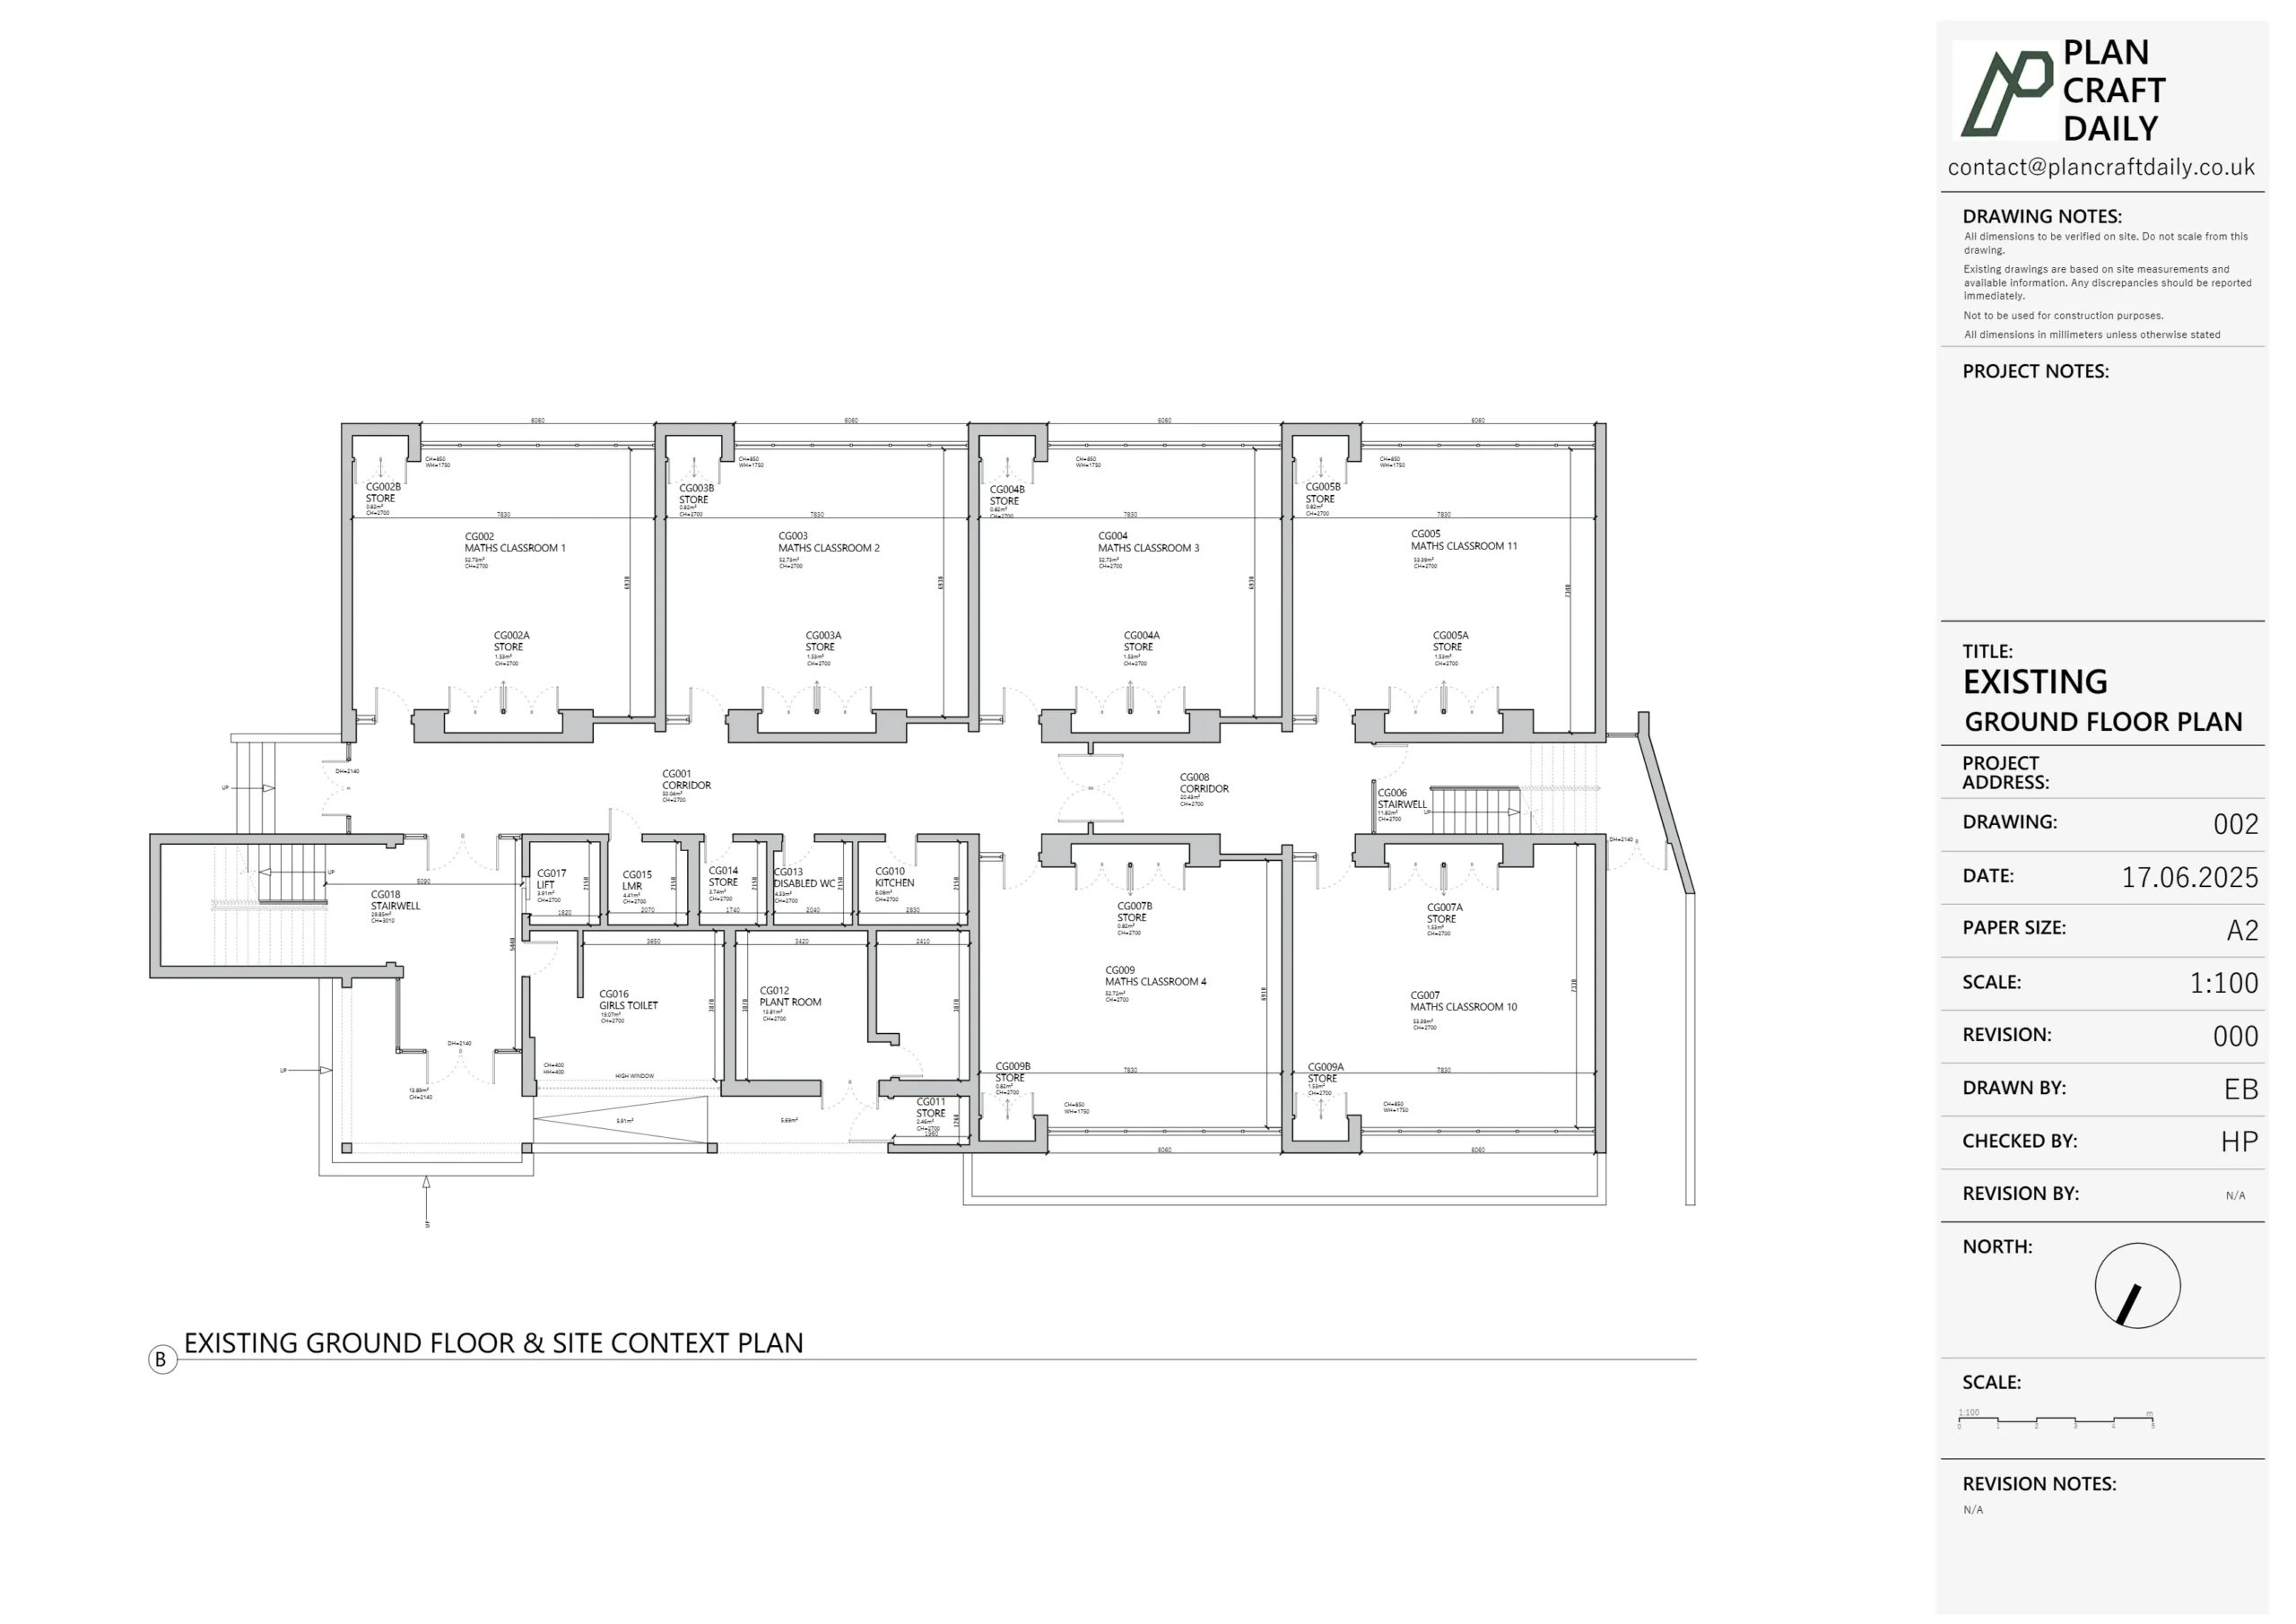
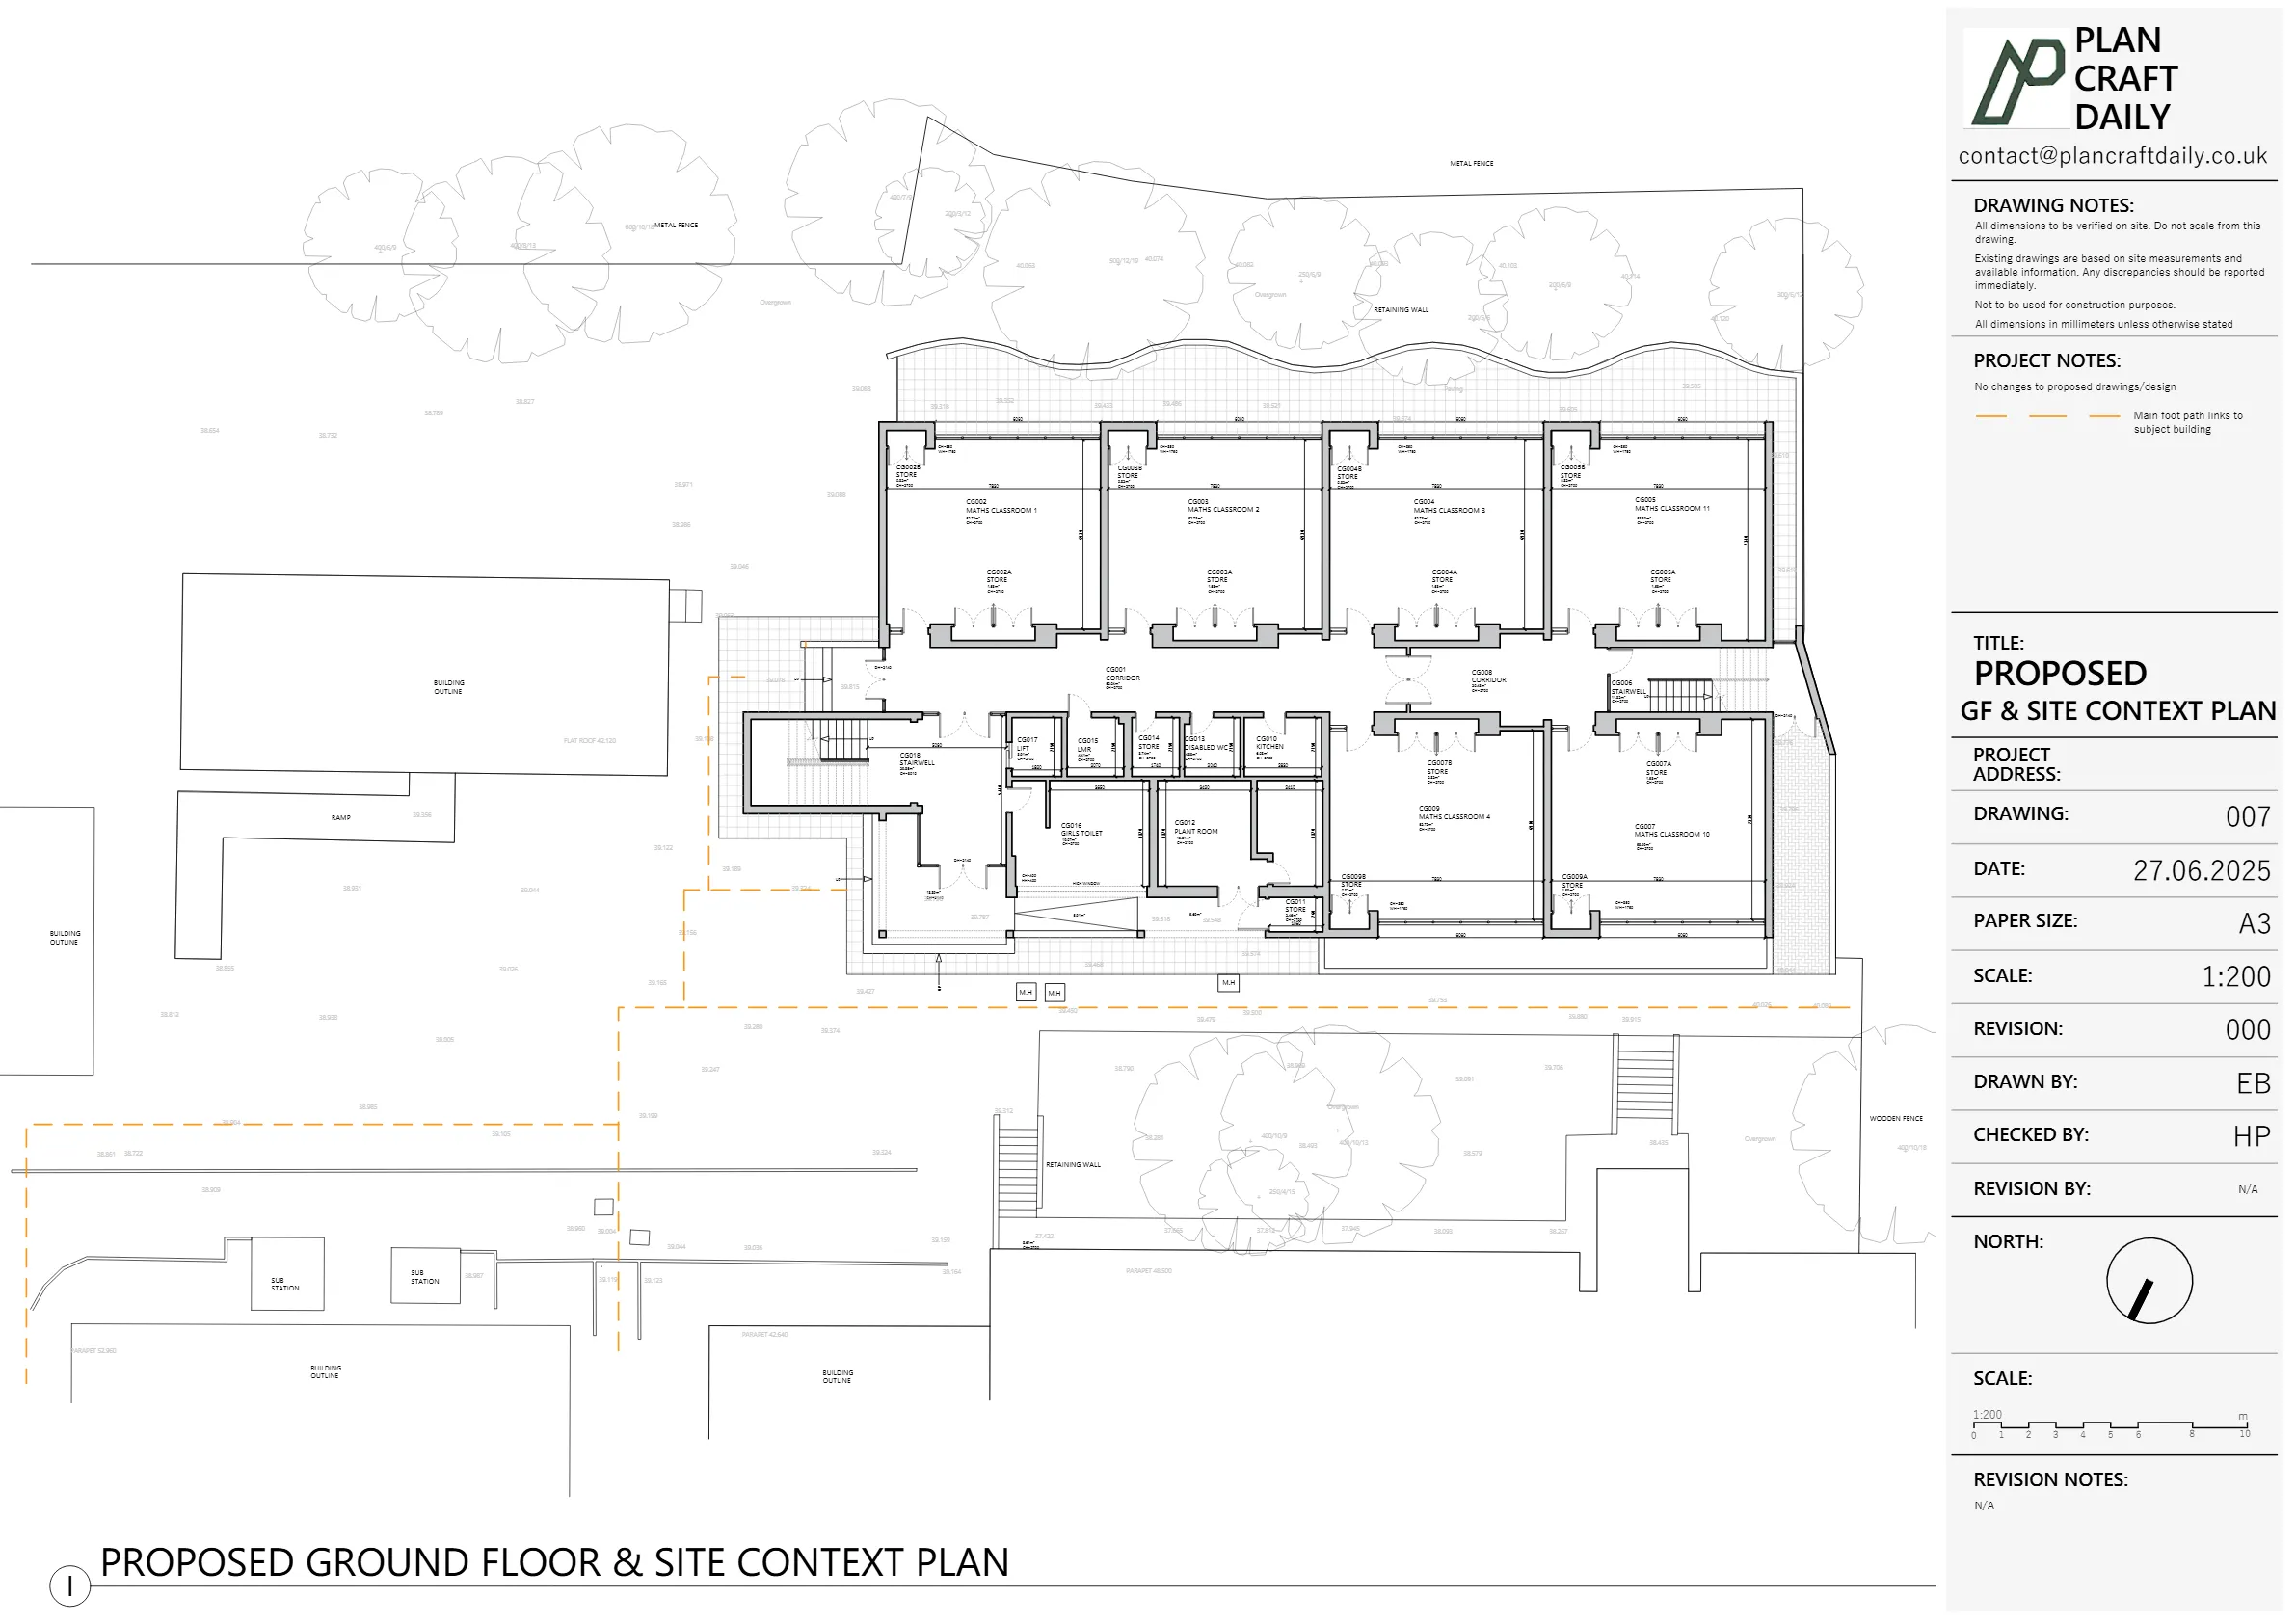
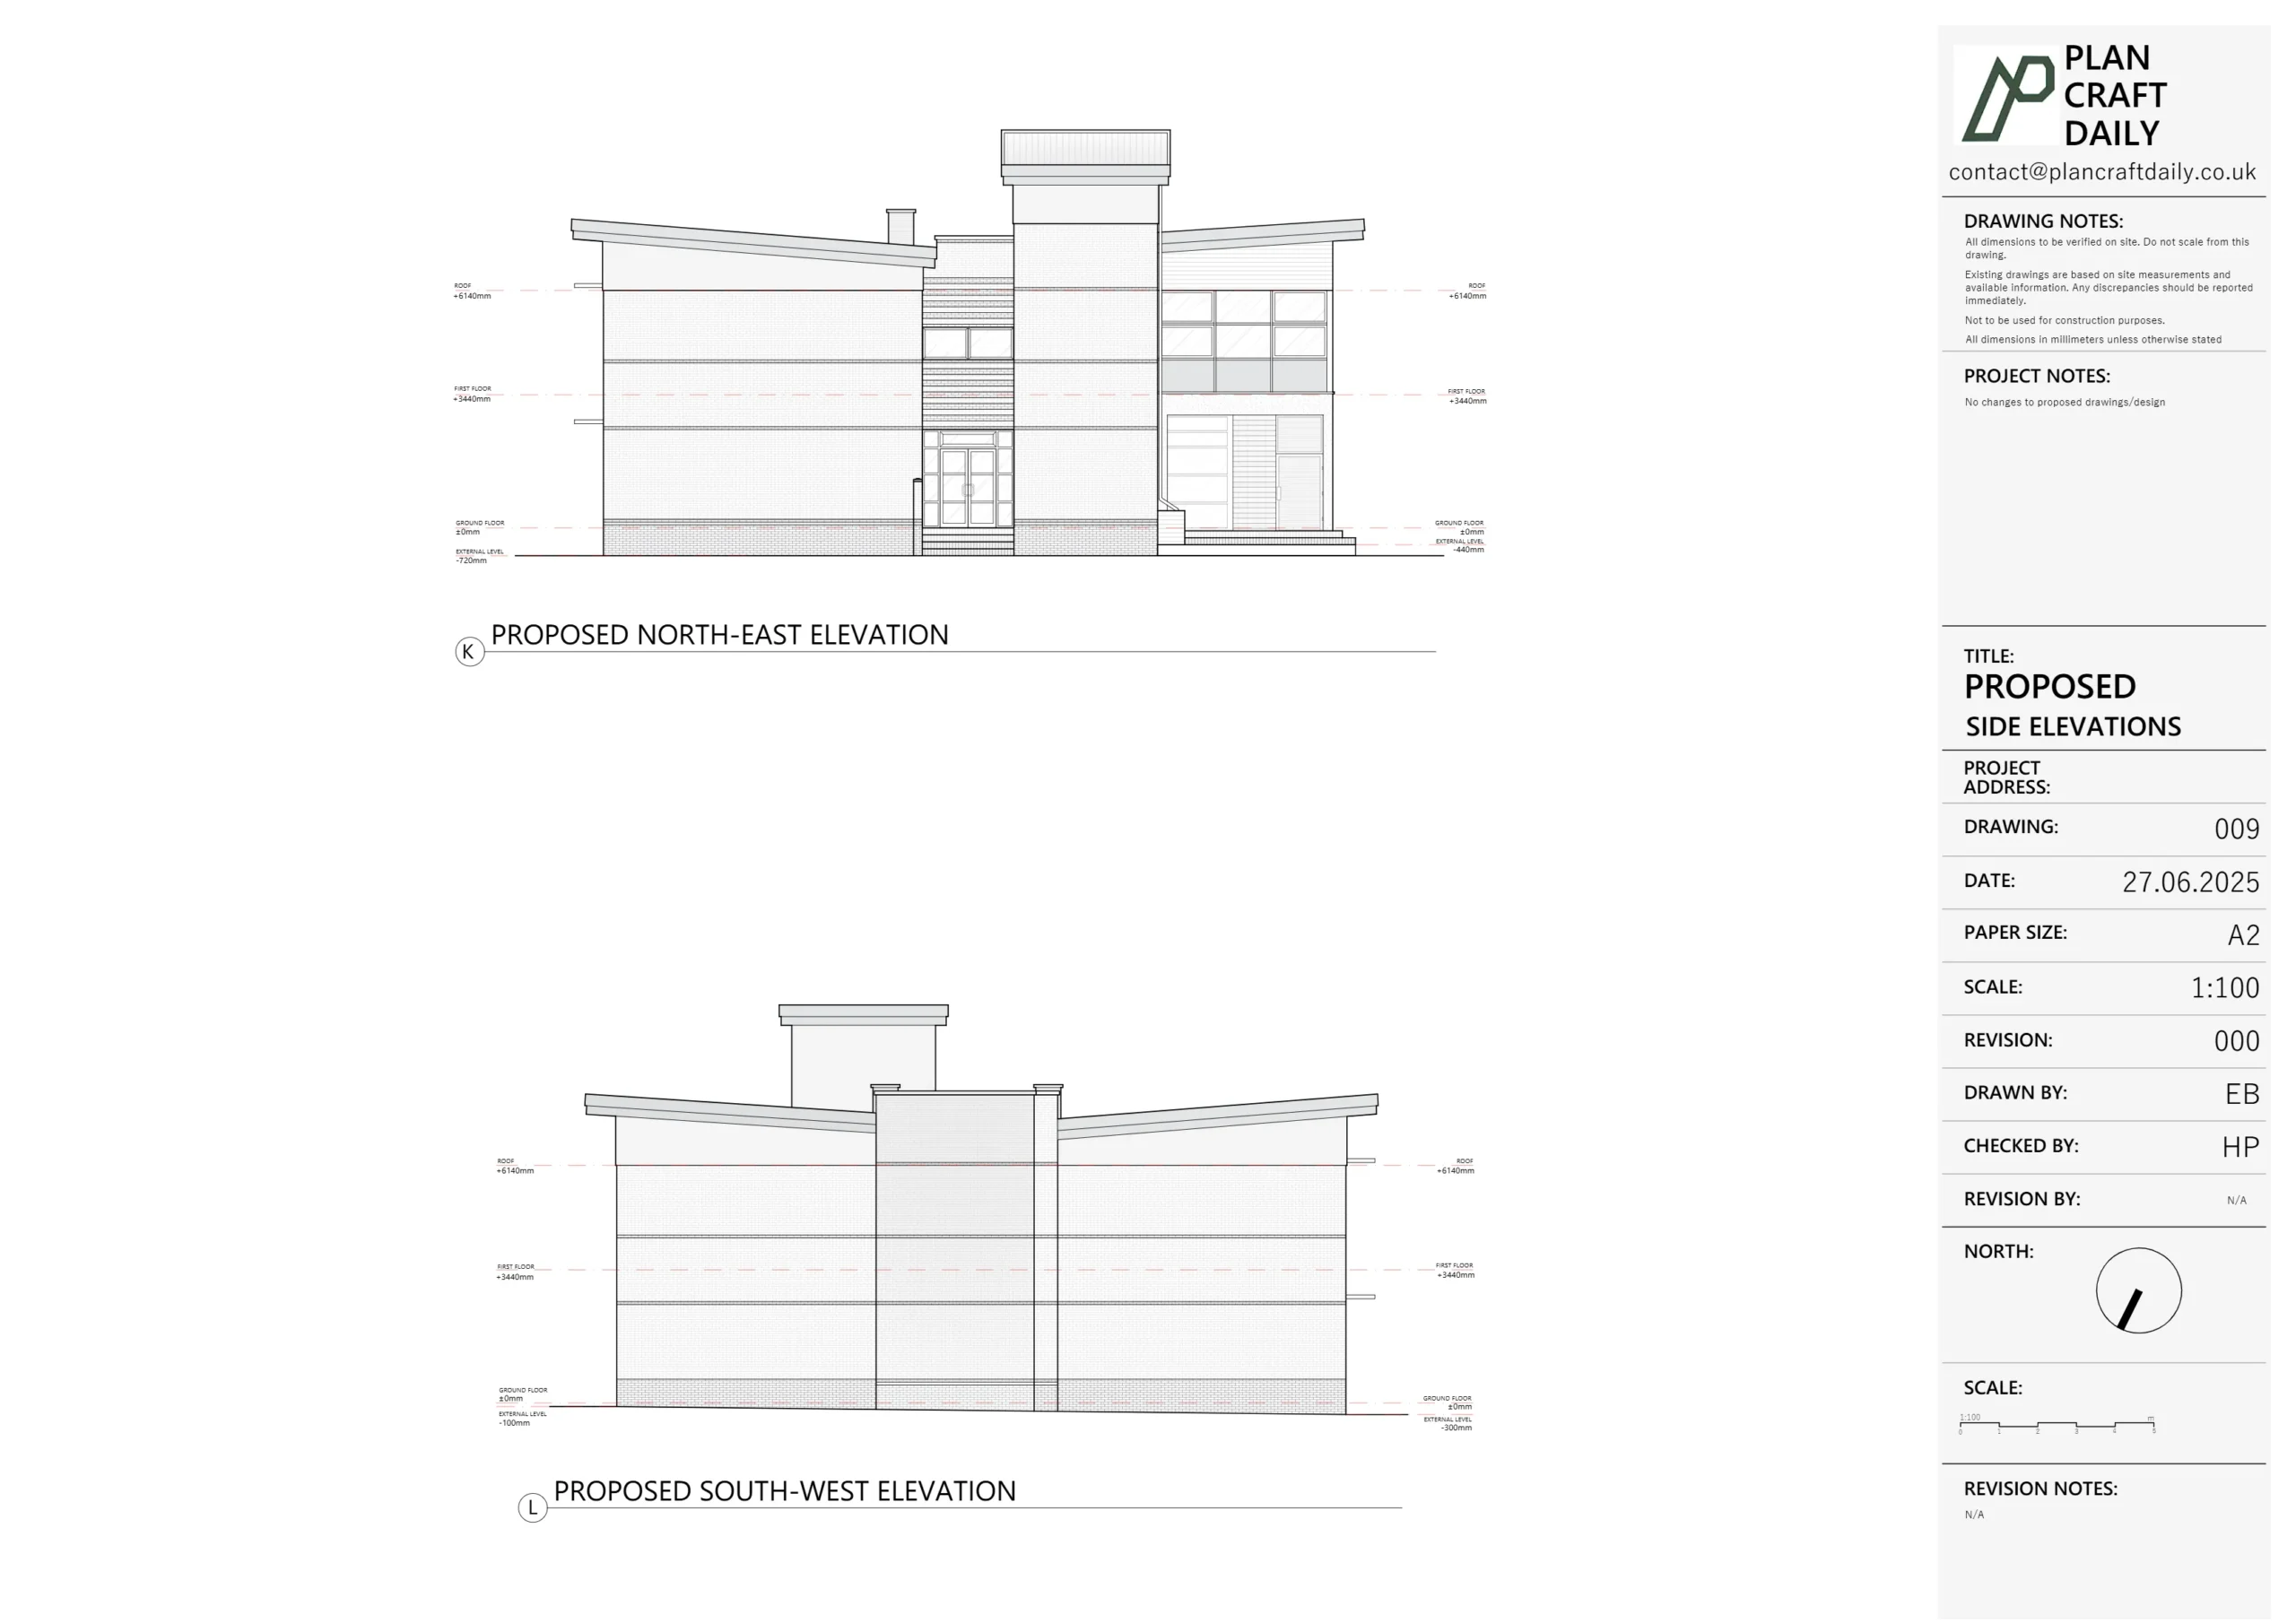
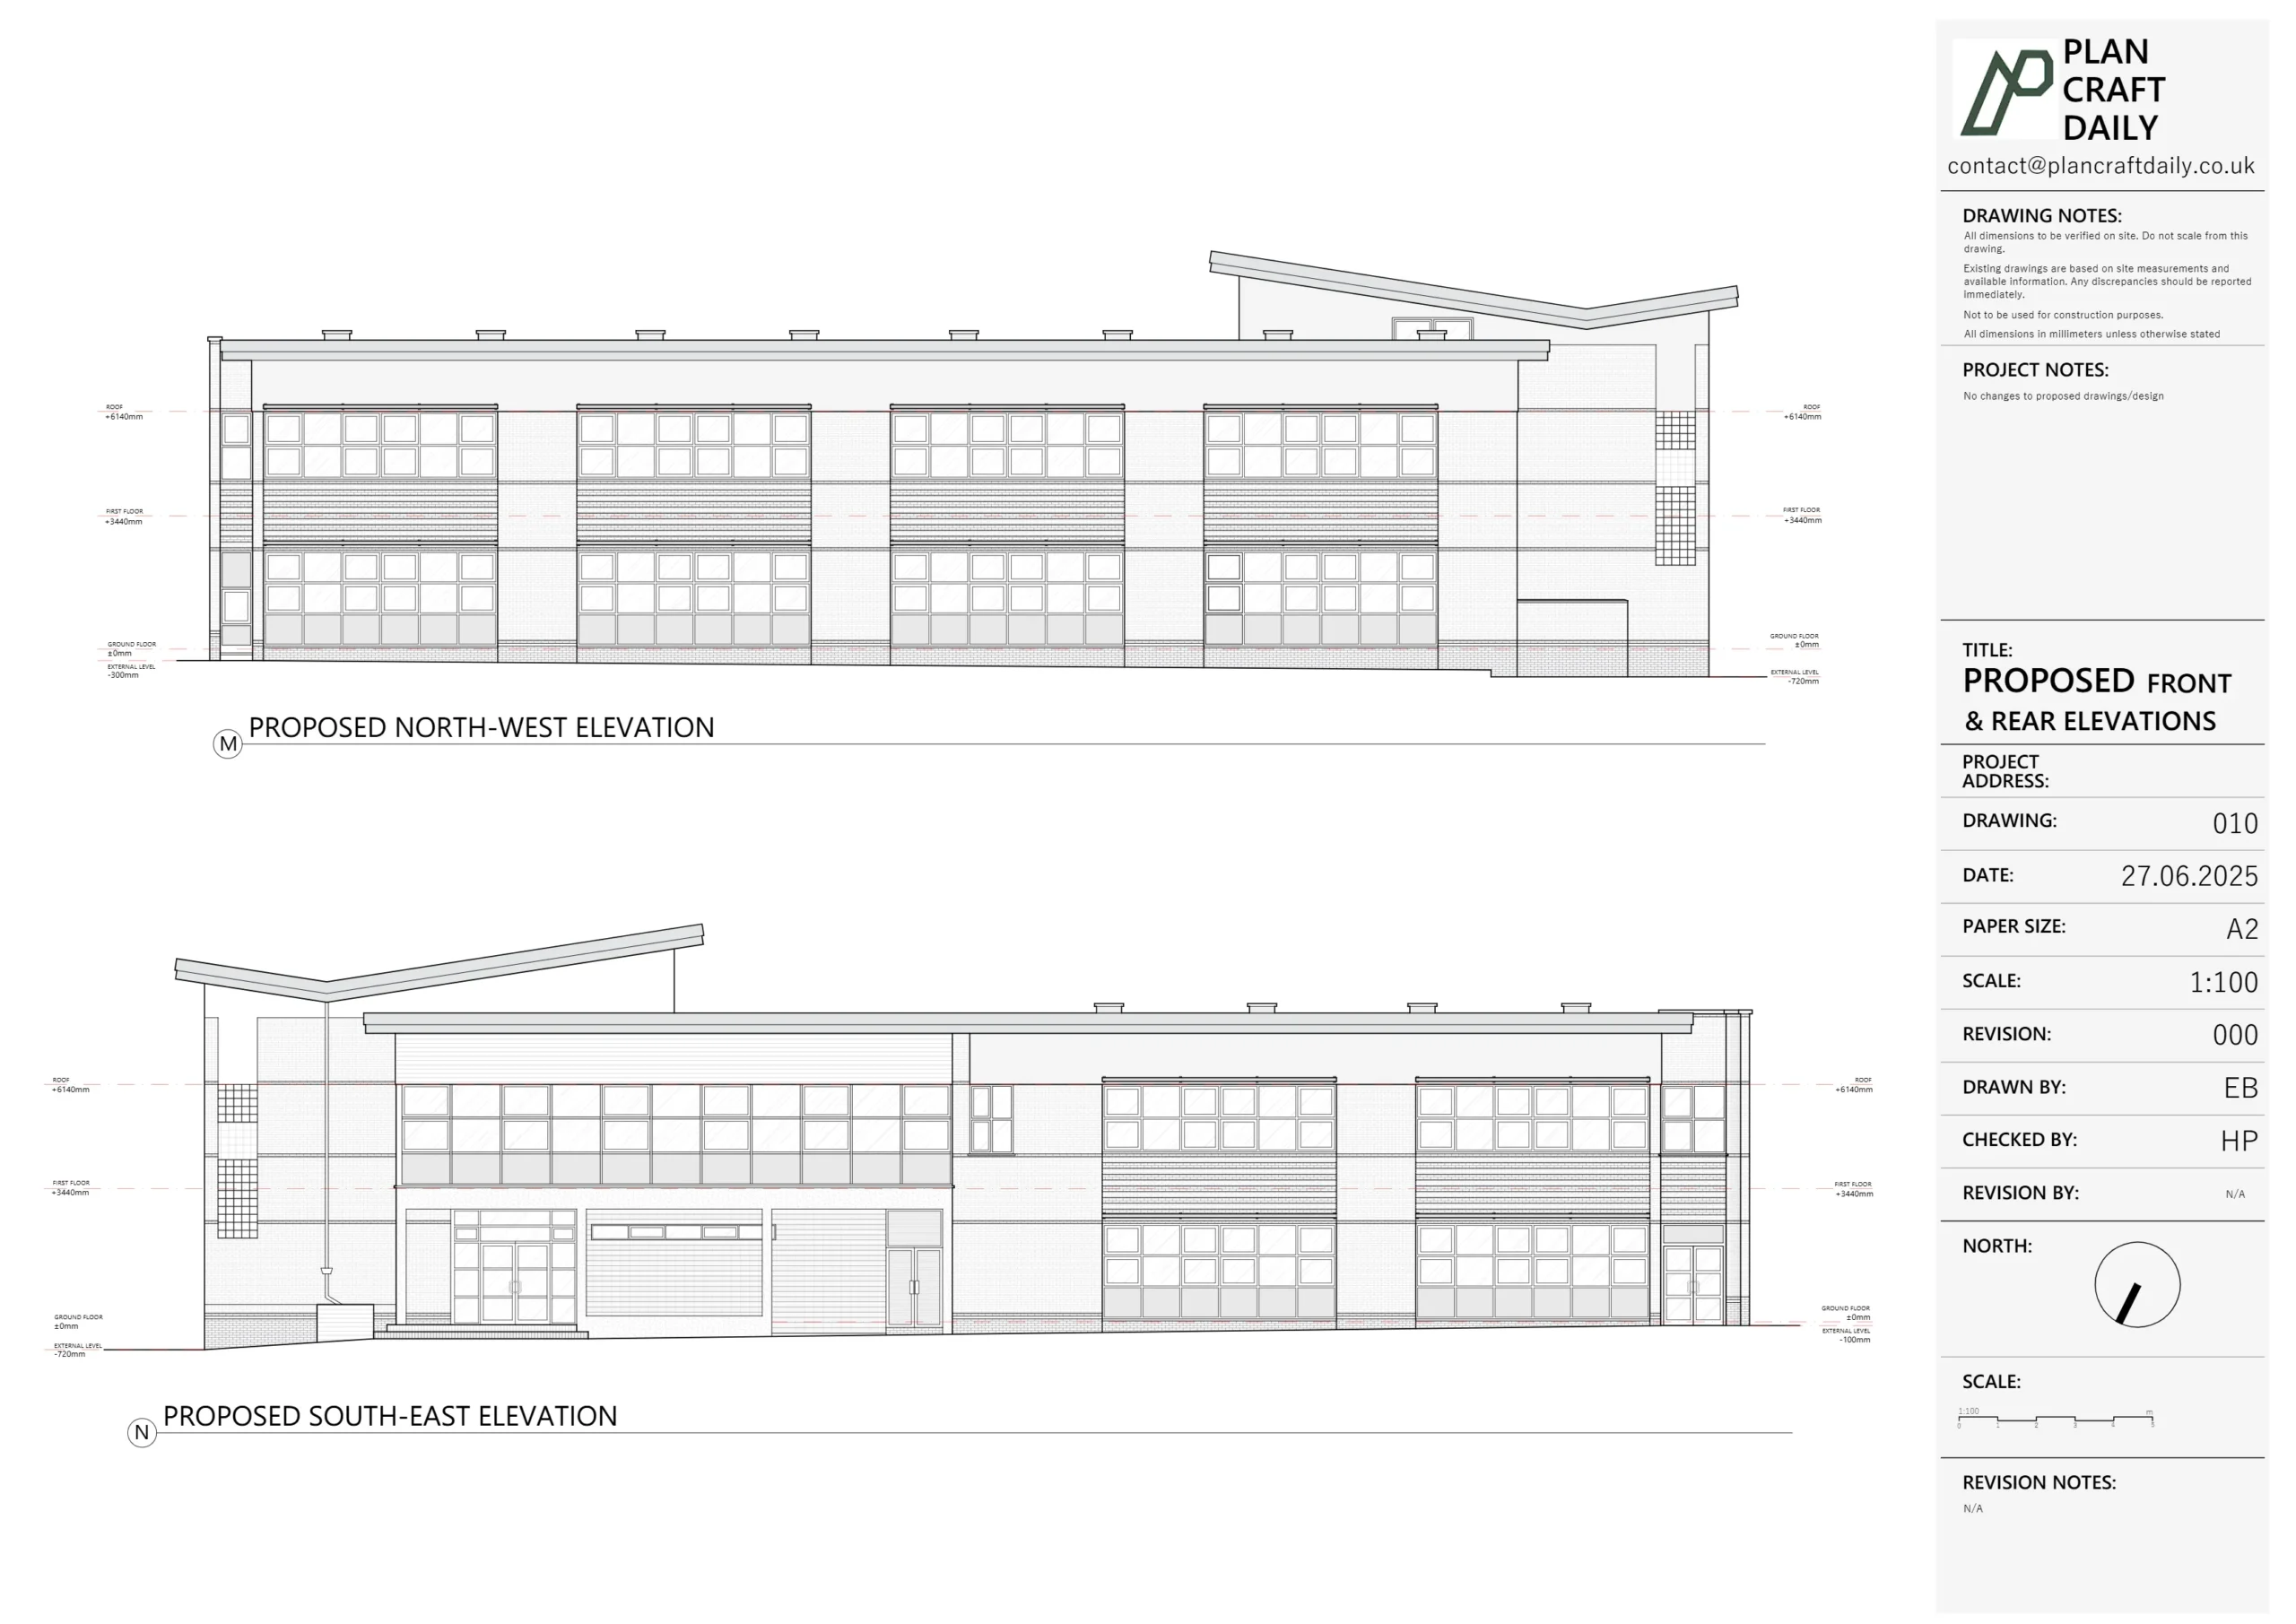
Buildings are normally shown as measured outlines with relevant levels and descriptive labels. The drawing can also record entrances, canopies, steps, overhangs and other external features requested in the survey brief.
Common building information includes:
- External wall positions
- Building corners
- Finished floor levels
- Threshold levels
- Door positions
- External steps
- Canopies
- Roof outlines where requested
- Outbuildings and garages
- Retaining structures attached to buildings
A finished floor level is the measured height of the completed internal floor surface. It may appear as “FFL” beside the relevant building or entrance.
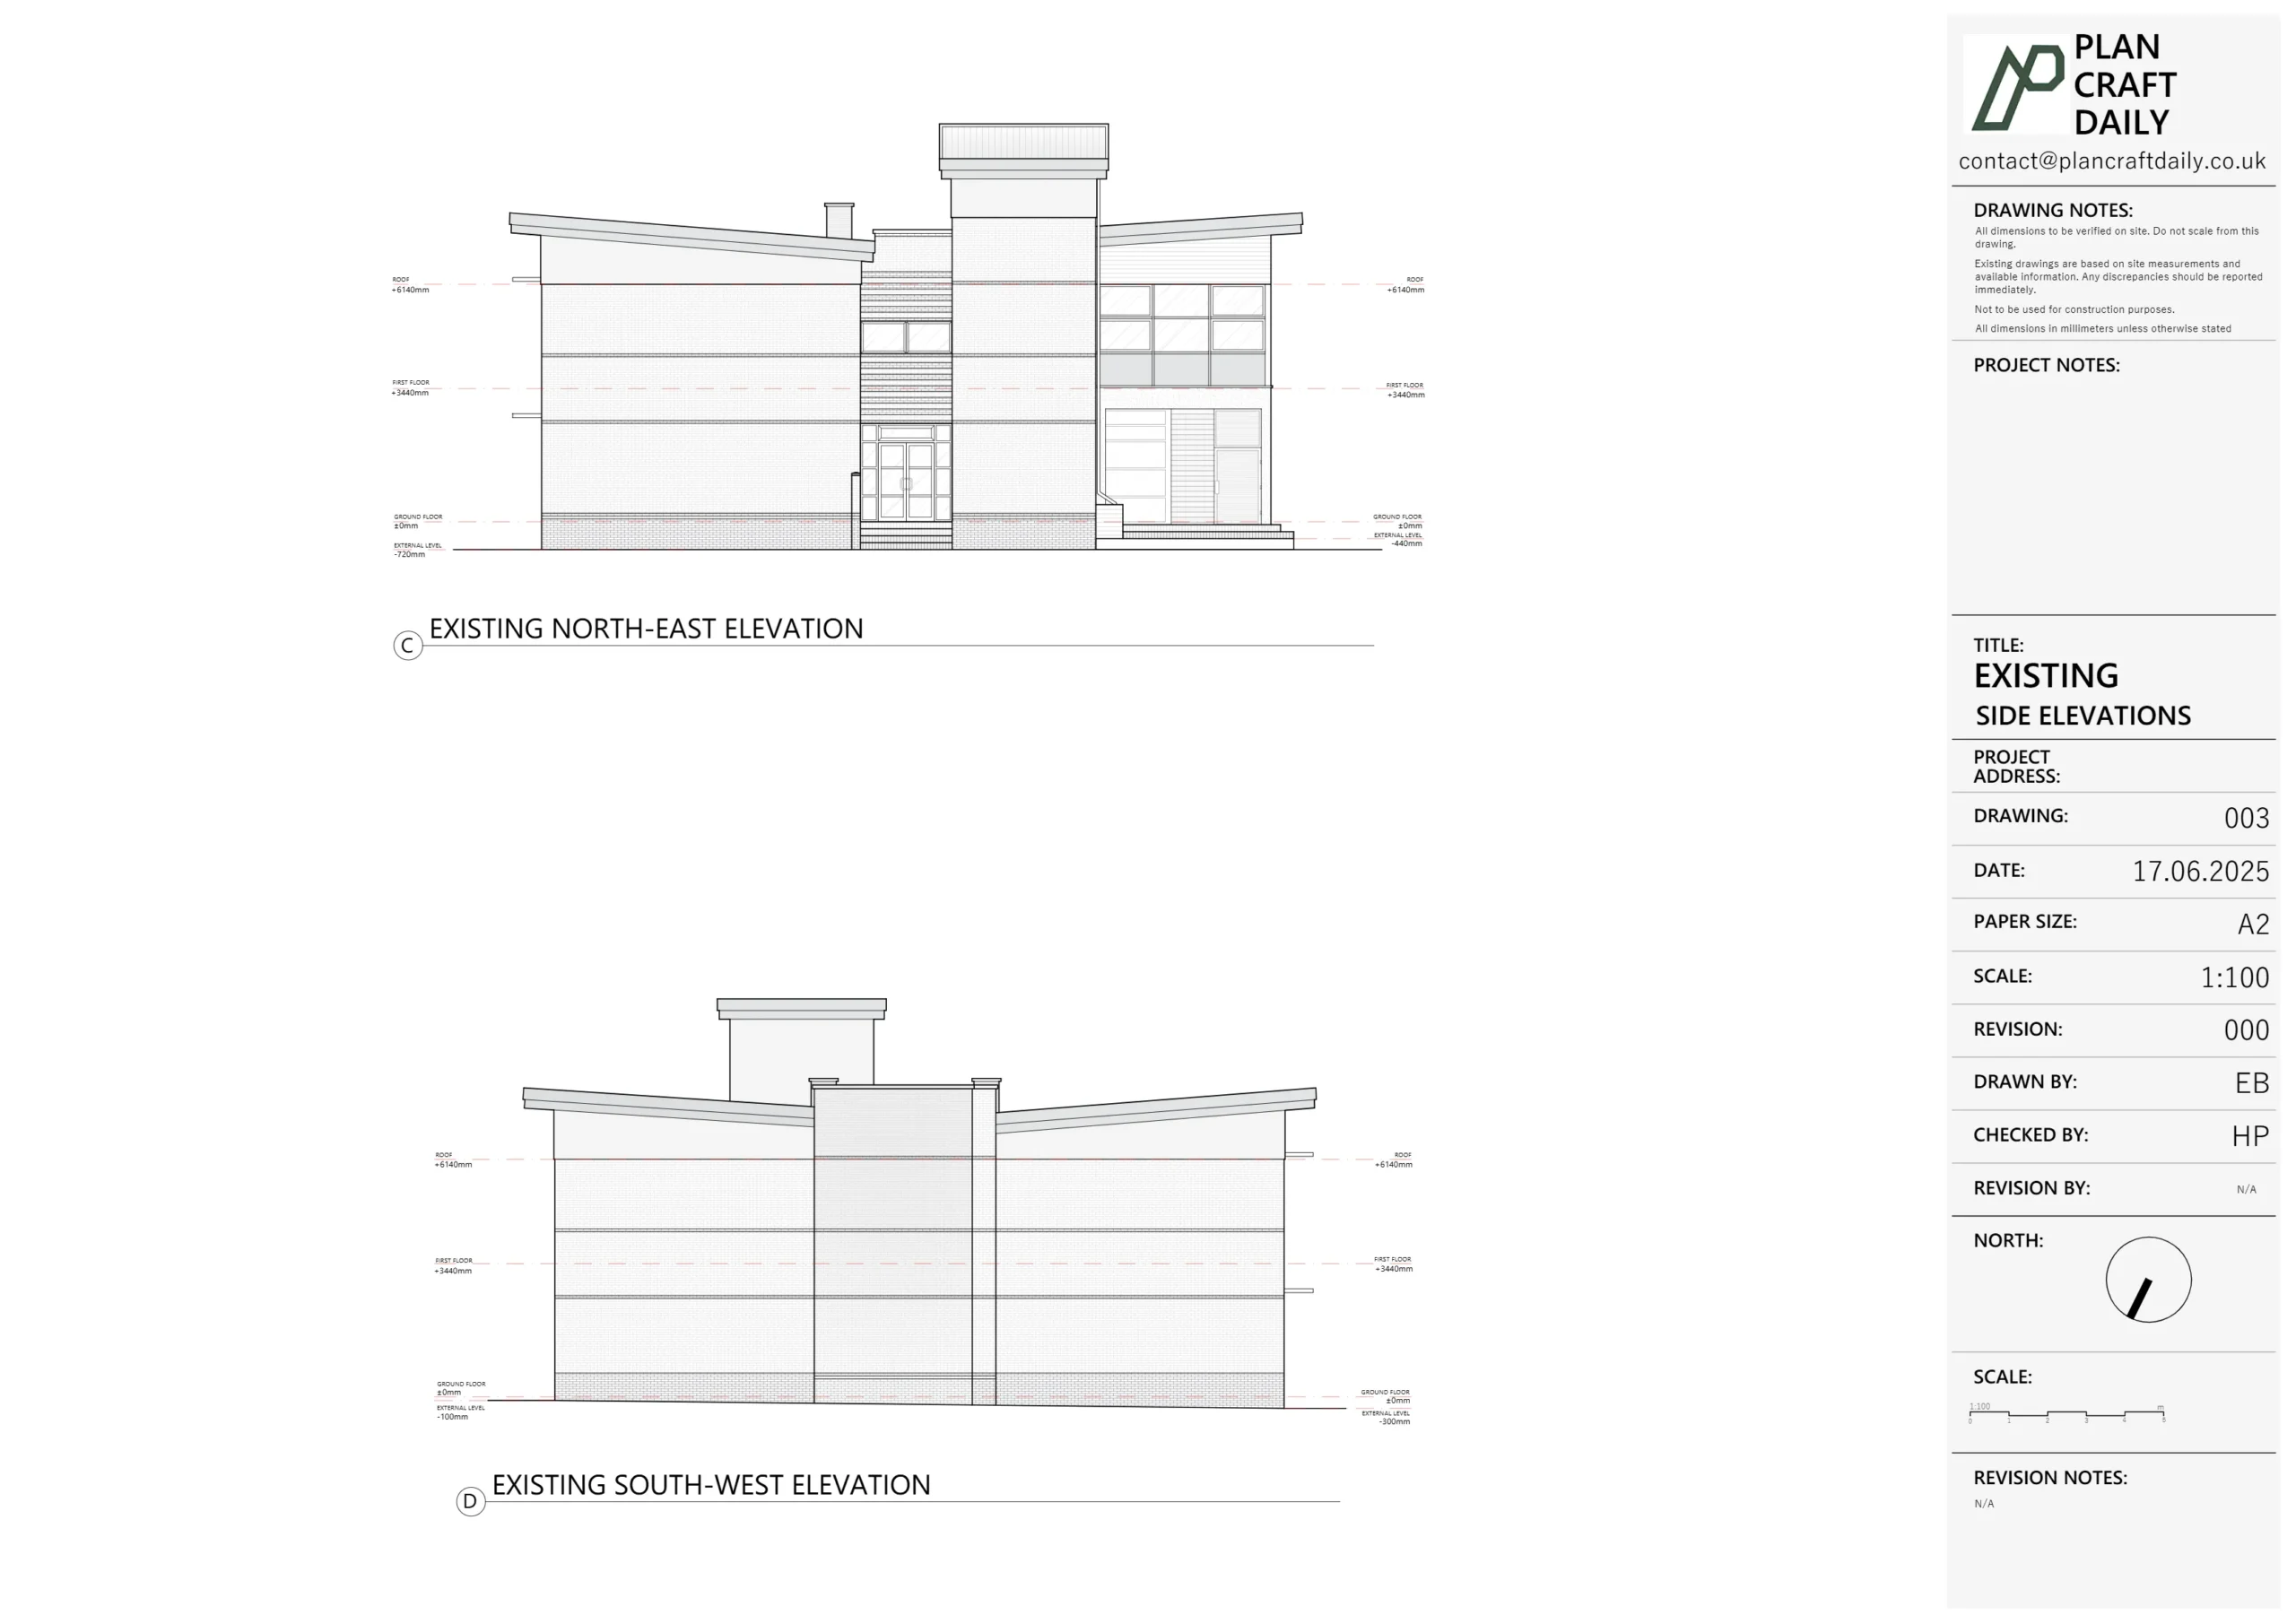
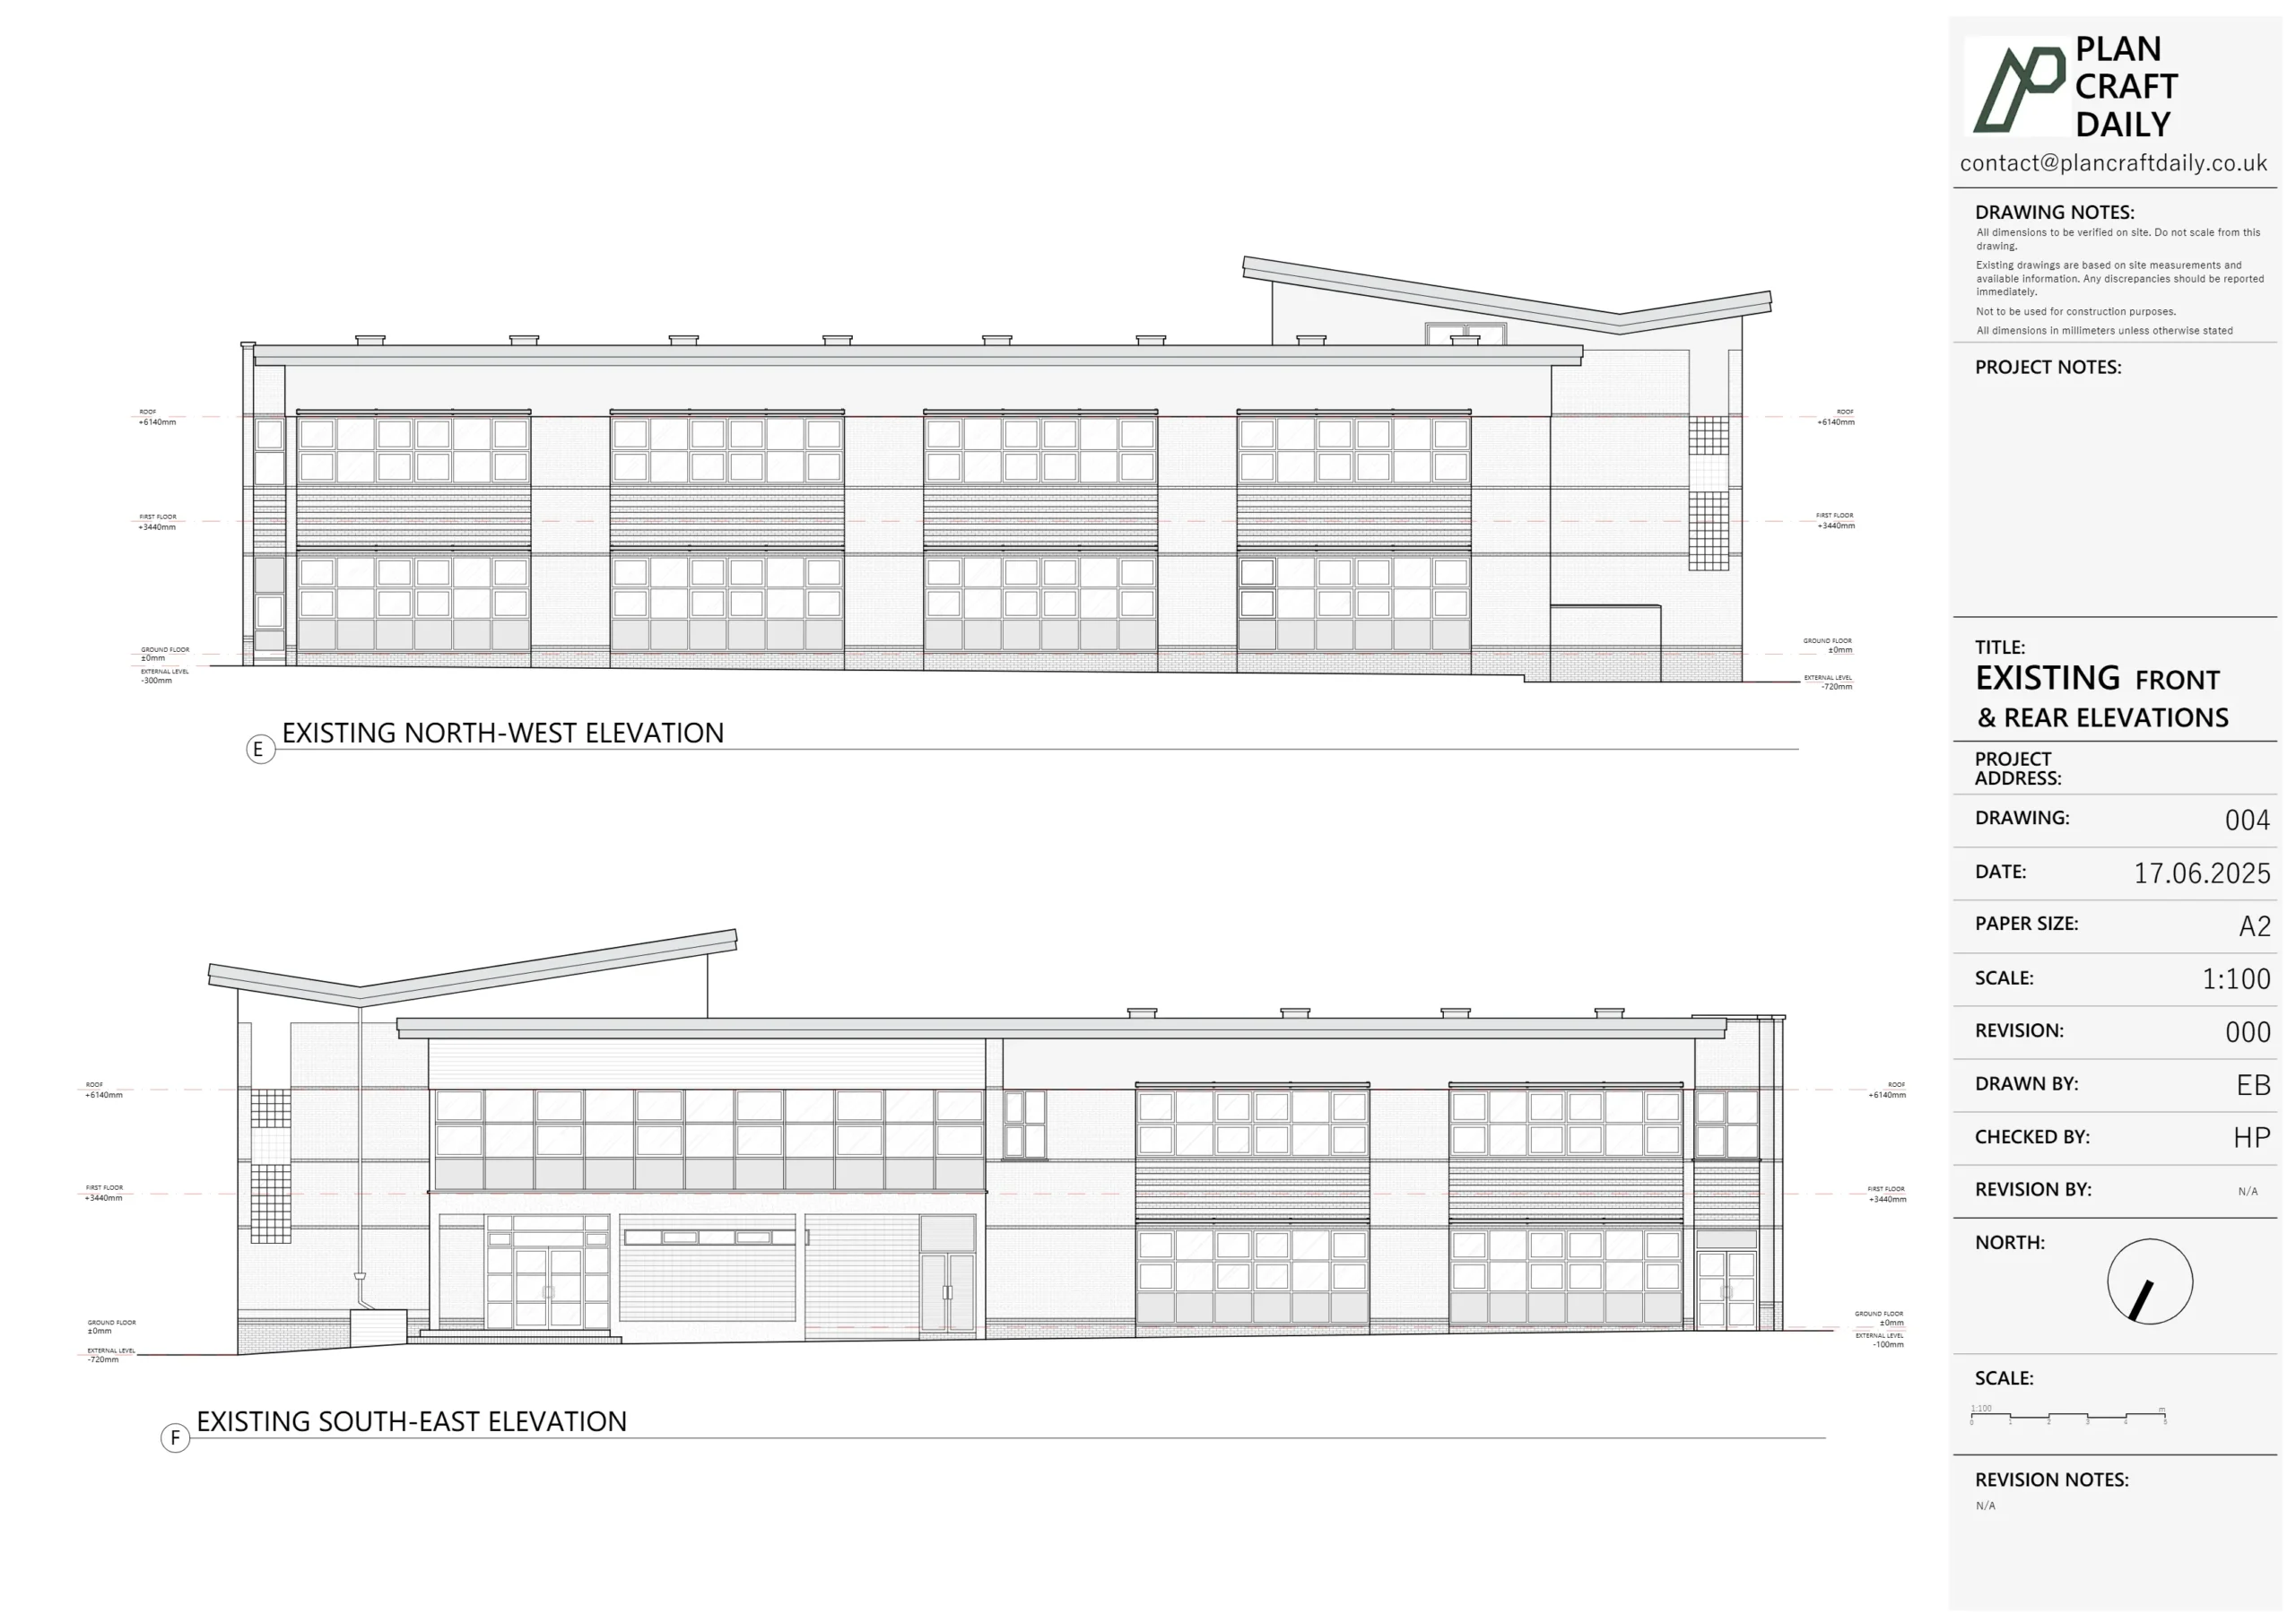
A topographical survey normally records external site information. It does not automatically include internal floor layouts, elevations or building sections.
Plan Craft Daily provides measured building surveys where the project requires detailed information about an existing building.
How are boundaries shown on a topographical survey drawing?
The drawing can show visible walls, fences, railings and hedges, but these features do not prove the legal boundary. They represent physical features measured during the site visit.
Different boundary features can use different line types or abbreviations.
The legend may distinguish between:
- Brick walls
- Timber fences
- Metal railings
- Chain-link fences
- Hedges
- Open boundaries
- Retaining walls
Check whether the surveyed line represents the centre, face or another measured position of the feature. The drawing notes can explain how the feature was recorded.
Do not use a visible fence line as automatic proof of ownership. Legal boundary interpretation can require title documents, deeds and specialist advice.
How are trees and vegetation shown?
Trees are normally shown using a trunk position and a circle or outline representing the canopy spread. Additional labels can record the tree number, trunk diameter or other requested information.
Common vegetation information includes:
- Tree trunk positions
- Approximate trunk diameters
- Canopy spreads
- Tree identifiers
- Hedge lines
- Shrub areas
- Significant vegetation limits
The canopy shown on the drawing represents measured or estimated physical spread according to the agreed survey scope. It does not state whether the tree is healthy, safe or suitable for removal.
An arboricultural survey provides specialist information about tree condition and development constraints. The topographical drawing supplies the spatial base used by the arboriculturist and design team.
How are drainage features shown?
Visible drainage features appear as measured symbols, outlines or labels at their surface positions. These features can include manholes, gullies, inspection covers and drainage channels.
Common drainage abbreviations include:
- MH for manhole
- IC for inspection chamber
- G or GU for gully
- CL for cover level
- IL for invert level
A cover level is the height of the cover at the surface. An invert level is the height at the bottom of the pipe or drainage channel.
Check the drawing legend because abbreviations can vary between survey providers.
A visible cover does not confirm the complete underground route, depth or condition of a service. Underground utility detection and CCTV drainage inspection require separate scopes.
How are roads, paths and hard surfaces shown?
Roads and hard surfaces are shown using measured edges, kerb lines, surface labels and level points. This information explains how vehicles and people move through and around the site.
The drawing can distinguish between:
- Carriageways
- Footways
- Dropped kerbs
- Driveways
- Paved paths
- Patios
- Gravel areas
- Concrete surfaces
- Steps and ramps
- Surface channels
Kerbs may have levels recorded at the top and bottom. These values help explain the height change between the road and pavement.
Surface labels should be read with the linework. A hatch or line pattern may represent a material, but the legend must confirm its meaning.
What do abbreviations and symbols mean?
The drawing legend defines the abbreviations, symbols and line styles used by the surveyor. Never assume that every surveying company uses identical notation.
Common abbreviations can include:
| Abbreviation | Common meaning |
|---|---|
| FFL | Finished floor level |
| CL | Cover level |
| IL | Invert level |
| MH | Manhole |
| IC | Inspection chamber |
| GU | Gully |
| LP | Lamp post |
| TP | Telegraph pole |
| BT | British Telecommunications cover |
| EP | Electricity pole |
| FH | Fire hydrant |
| SV | Stop valve |
| WL | Water level |
| TW | Top of wall |
| BW | Bottom of wall |
| FL | Floor level |
These are common meanings rather than universal rules. Always use the legend printed on the specific drawing.
An unexplained abbreviation should be referred back to the surveyor before the drawing is used for design or construction.
What do the coordinate grid and survey control points show?
The coordinate grid establishes the measured horizontal position of features across the site. Survey control points provide fixed references that support consistent measurement and future setting-out work.
The drawing notes should state whether the survey uses:
- A local project grid
- The Ordnance Survey National Grid
- Another specified coordinate system
Eastings and northings are numerical coordinates used to position a point. Eastings describe its east-to-west position, while northings describe its north-to-south position within the chosen grid.
Do not combine drawings that use different coordinate systems without a verified transformation. Features can appear correctly shaped while sitting in the wrong geographical position.
The RICS measured survey specification provides guidance on survey control, accuracy and project requirements.
How can you tell what was not surveyed?
Read the survey notes, scope and exclusions to identify information that was not measured or verified. Blank space on the drawing does not always mean that the physical area was empty.
An area can be incomplete because it was:
- Outside the agreed survey boundary
- Inaccessible during the site visit
- Hidden by vegetation
- Blocked by vehicles or stored materials
- Outside the required level of detail
- Unsafe to enter
- Not visible from the available survey positions
The survey notes can also explain whether features were traced from third-party information rather than measured directly.
Ask the surveyor about unclear or incomplete areas before using the drawing for design decisions.
Can you measure directly from a topographical survey PDF?
A PDF can support review, but precise design measurements should come from verified dimensions or the original CAD data. A PDF can be enlarged, reduced or printed at the wrong paper size.
The DWG file is an editable computer-aided design file. It preserves the survey geometry for use by architects, engineers and designers.
Before measuring from a PDF, confirm:
- The stated scale
- The required paper size
- The print setting
- The presence of a scale bar
- Whether the document has been resized
- Whether the measurement needs design-level accuracy
Never scale from a screenshot or photograph of a drawing.
What should you do if the topographical drawing is unclear?
Ask the surveyor to explain any unclear symbol, note, level or feature before using it. The surveyor can confirm the recorded information and determine whether the drawing needs clarification or revision.
Provide:
- The drawing number
- The drawing revision
- The exact location of the query
- A screenshot or marked extract
- The feature or value requiring clarification
- The design decision affected by the query
Do not edit the original survey drawing without recording the change. Uncontrolled amendments can make measured information difficult to distinguish from later design work.
How can Plan Craft Daily help?
Plan Craft Daily provides topographical survey drawings for property projects across London and the Home Counties. The agreed outputs can record site levels, buildings, visible boundaries, trees, access features and visible drainage information.
Send the site address, marked survey area and your design team’s requirements when requesting a quotation.
Visit the topographical survey service page to learn more or request a quote.